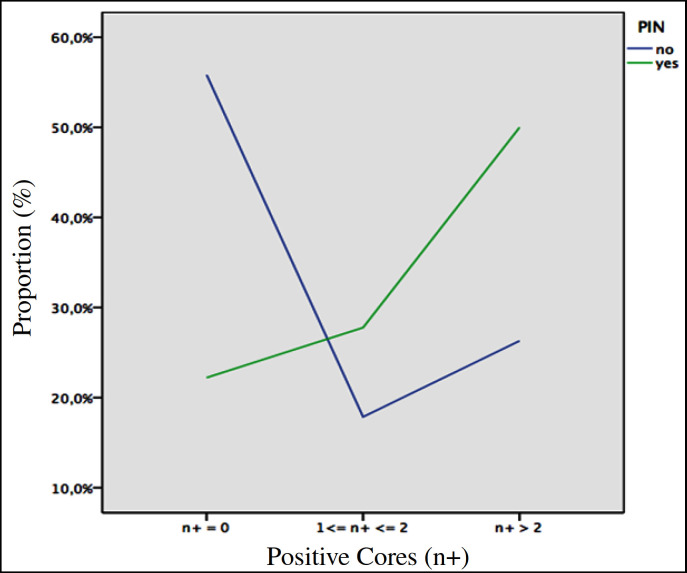
Fig. 3.
Proportion of positive cores according to the presence or absence of PIN in the biopsy core in the cohort of patients who are stratified into 3 groups that include cases whose number of positive cores are zero (n+ = 0; control group), between 1-2 or more than 2 (see results and discussion for details). n+ = 0, negative cores; 1 ≤ n+ ≤ 2, positive core between 1 and 2; n+ >2, positive cores more than 2.

