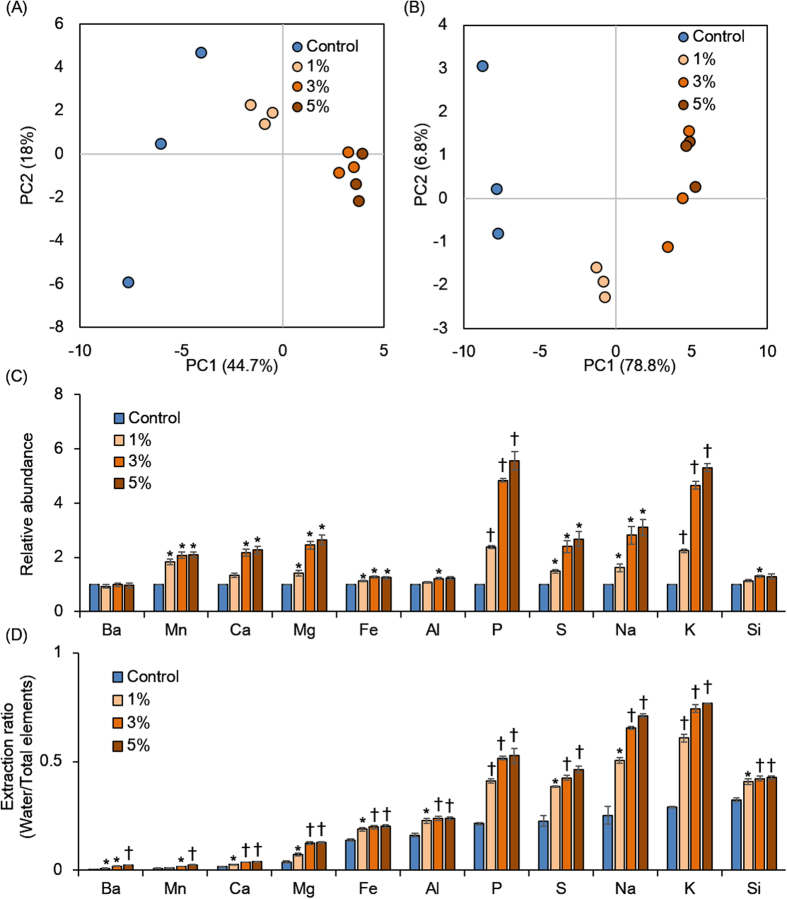
Figure 3. Evaluation of elemental components in soils.
Soil elemental profiles were evaluated from extractions of water (A) and HNO3 (B) using PCA score plots and the relative abundance of soil total elements compared the control with torrefied biomass (C) and extraction ratios compared water with total extracted elements (D). The error bars show the standard error of the mean and the p value for comparison of the control with each sample calculated using Welch’s t test. ∗p < 0.05 and †p < 0.01.

