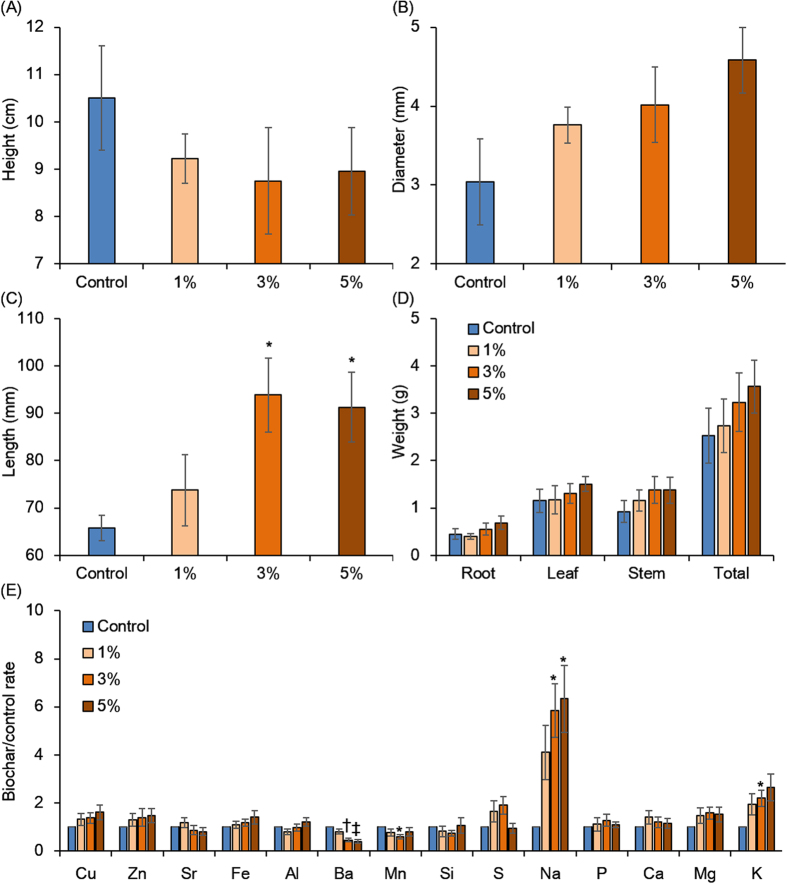
Figure 4. Evaluation of the effect of torrefied biomass on the initial plant growth stage.
The effect of torrefied biomass on the plant phenotype during the initial growth stage was evaluated by plant height (A), stem diameter (B), root length (C), whole weight (D), and elemental content ratios of torrefied biomass to the control (E). The error bars show the standard error of the mean and the p value for comparison of the control with each sample, calculated using Welch’s t test. *p < 0.05 and ‡p < 0.005.

