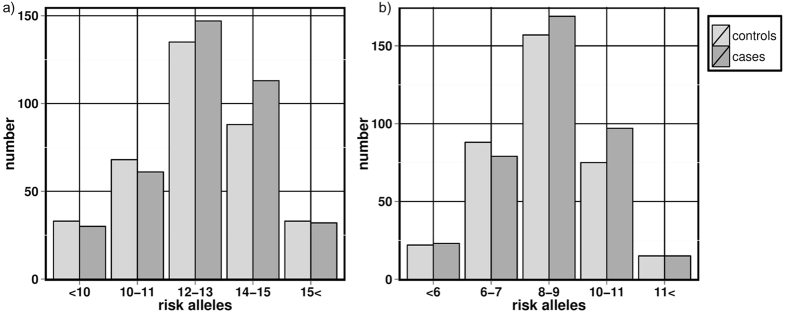
Figure 2. Distribution of risk alleles among dyslexia-cases and controls.
(a) Cases and controls with the total sum of all reported risk alleles from all included 11 independent SNPs. (b) Cases and controls with the total sum of all reported risk alleles but excluding all three SNPs associating at single marker level in our cohort.

