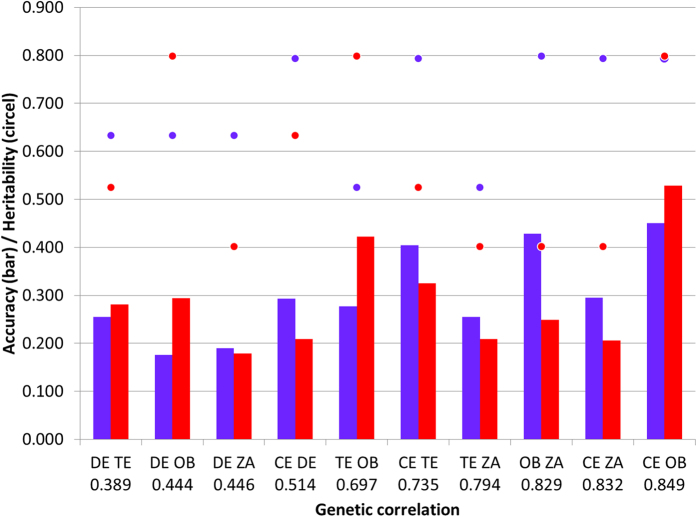
Figure 4. Bar plot of the prediction accuracy for all pairwise-site arranged by their genetic correlations for grain yield.
The heritability for each site within the pair is represented by a circle. For each pair-wise the prediction is direct and reciprocal. Abbreviations: CE: Celaya; DE: Delicias; TE: Tepatitlán; OB: Cd. Obregón; ZA: Zaragoza.

