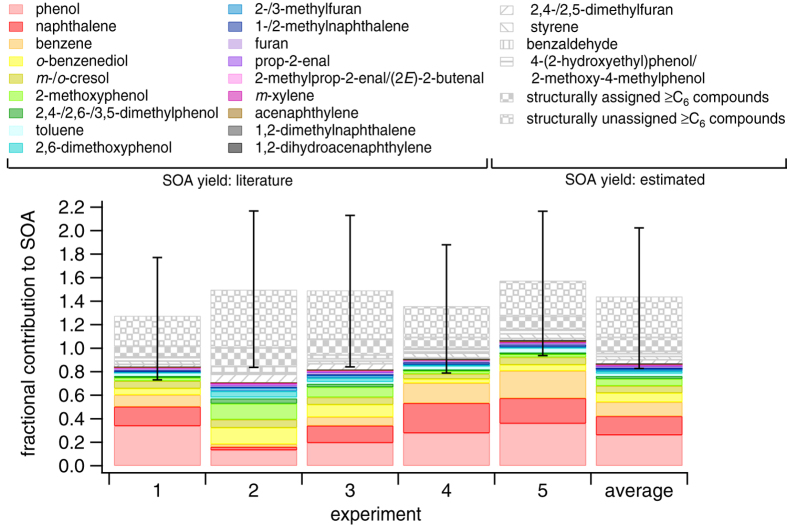
Figure 1. Fractional contribution of 22 individual NMOGs and two lumped NMOG categories to observed SOA for each experiment and the average of all experiments.
Contributions are determined after exposure to (4.5–5.5) × 107 molec cm−3 h OH. Solid bars represent individual species for which SOA yields are published and patterned bars represent species for which SOA yields are estimated. Error bars correspond to the range of possible contributions assuming the lowest and highest reasonable SOA yields for each compound. The yield uncertainty is estimated to be ±50% for species with estimated SOA yields and for o-benzenediol as only a single measurement is available in the literature.

