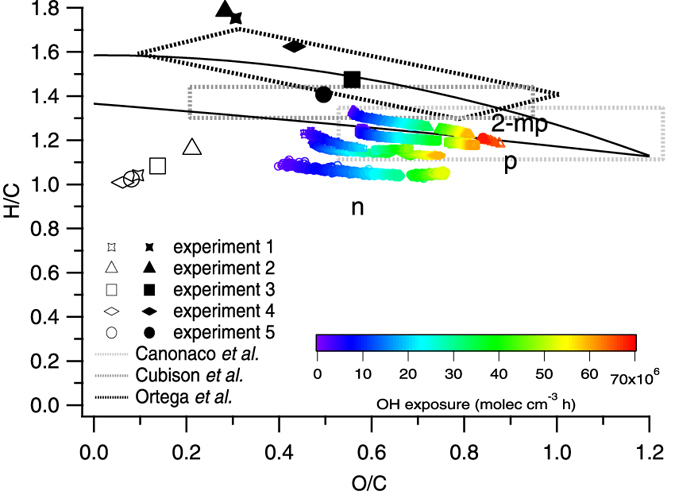
Figure 2. Elemental composition of SOA, POA and mass concentration-weighted average of 22 primary NMOGs.

Colored traces correspond to SOA as a function of OH exposure, open black data points correspond to NMOGs and solid black data points correspond to POA for each experiment. Lettered data points correspond to literature values of SOA formed during aging of individual precursors (phenol, p; naphthalene, n; 2-methoxyphenol, 2-mp)34,47. Solid black lines correspond to the region encompassing typical ambient experiments46 and dashed gray lines encompass measurements of laboratory SOA from open biomass burning48 and ambient OA measurements impacted by open biomass burning49 and residential burning50.
