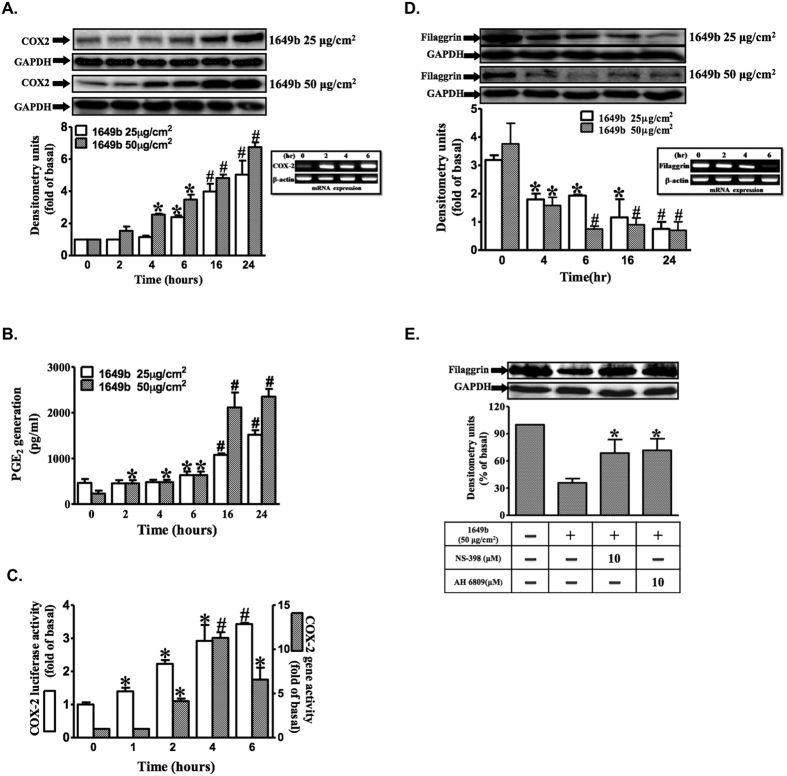
Figure 1. PMs up-regulate COX2 expression and increase PGE2 production, but down-regulate filaggrin expression in HaCaT cells.
HaCaT cells were exposed to PMs (25 and 50 μg/cm2) for the indicated times (0, 2 h, 4 h, 6 h, 12 h and 24 h). (A,D) COX2 and filaggrin expression was determined by Western blotting and RT-PCR. Total glyceraldehyde 3-phosphate dehydrogenase (GAPDH) and β-actin were used as loading controls for protein and mRNA expressions, respectively. (B) PGE2 release was induced by PMs, and the conditioned media were collected from (A) to assay PGE2 level by ELISA as described in “Materials and methods” (n = 3 in each group; *P < 0.05, #P < 0.01 compared with vehicle). (C) COX2 gene expression was analyzed by real-time PCR and by promoter luciferase activity as described in “Materials and methods”. (E) HaCaT cells were pre-incubated with NS-398 (10 μM) or AH6809 (10 μM) for 1 h and then exposed with PMs (50 μg/cm2) for 24 h. Filaggrin expression was determined by Western blotting. (A–D) Data are expressed as mean ± standard error of the mean, based on three independent experiments. *P < 0.05, #P < 0.01, compared with basal levels.

