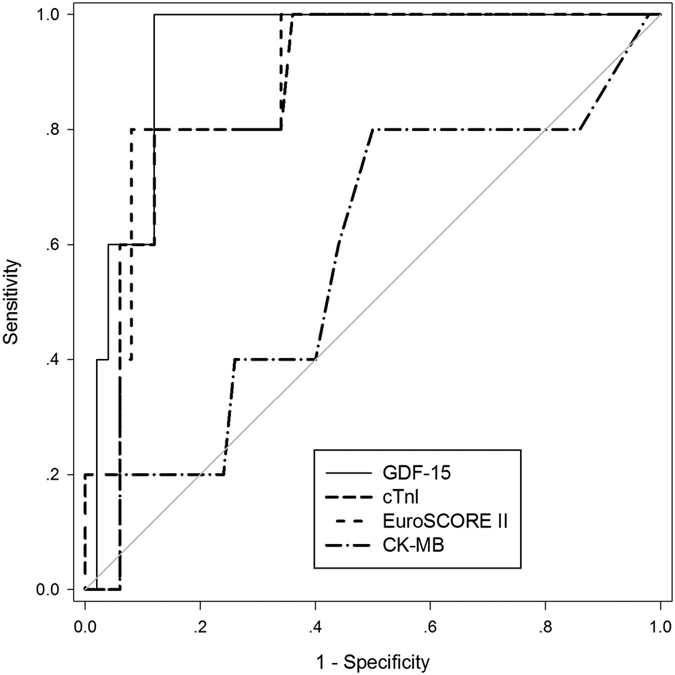
Figure 5. Receiver operating characteristic (ROC) curves comparing sensitivity and specificity of GDF-15, cTnI, CK-MB and EuroSCOREII for the identification of PMI at 12 h after OPCAB.

The thin diagonal line is the Null Hypothesis: True area = 0.50. PMI was predicted by GDF-15 levels with an area under the curve (AUC) of 0.94 (95%CI 0.87–1.01, P = 0.001) and cTnI with an AUC of 0.88 (95% CI 0.75–1.02, P = 0.005), and EuroSCOREII with an AUC of 0.88 (95% CI 0.75–1.00, P = 0.006). As for CK-MB, for a cutoff value of 6.5U/l, the sensitivity was only 80.0% and the specificity 50.0%, with an area under the ROC curve of 0.576(0.28–0.87).
