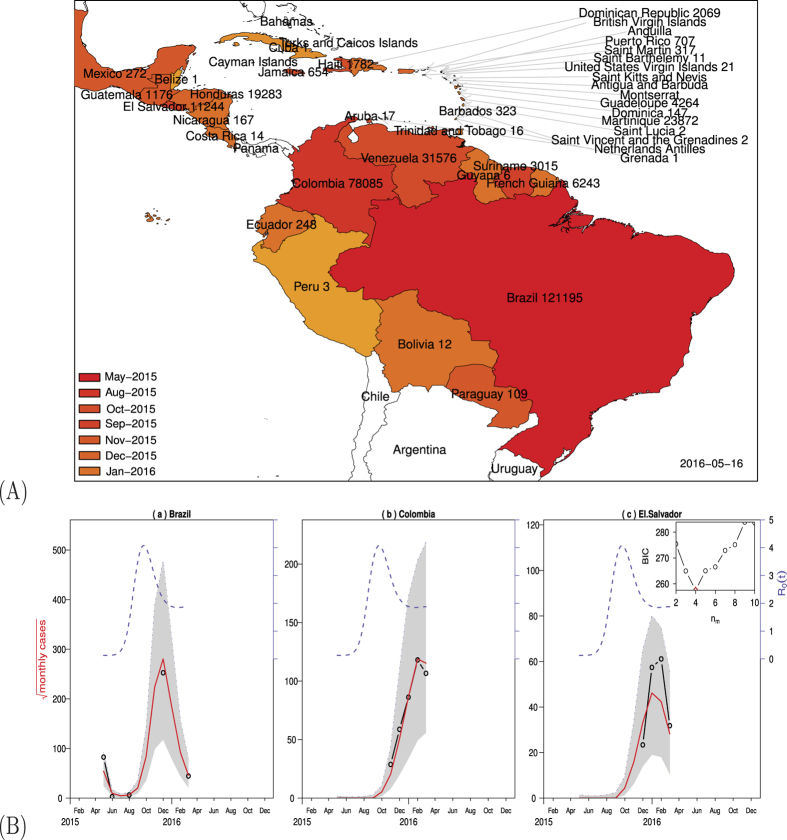
Figure 2.
(A) ZIKV outbreaks in South and Central Americas. The map indicates the month of first reported cases and the cumulative cases by May 16, 2016, in each country. The map was made with the free software “R: A Language and Environment for Statistical Computing, R Core Team, R Foundation for Statistical Computing, Vienna, Austria (2016) https://www.R-project.org.” accessed on February 1, 2016. (B) Fitting model to data in Brazil, Colombia, and El Salvador up to February 27, 2016. Each panel shows the simulation (red solid curve) versus the observed (black circle), with the best fitting parameters. The red solid curves show median values of 1000 simulations and shaded region show the 95% range. The blue dash curves show the estimated mosquito-human population ratio m(t). The inset panel shows Bayesian Information Criterion (BIC) as a function of the number of nodes (nm) in m(t) with values mi at these nodes. Assumed or estimated parameters and initial conditions are given in Table 2.

