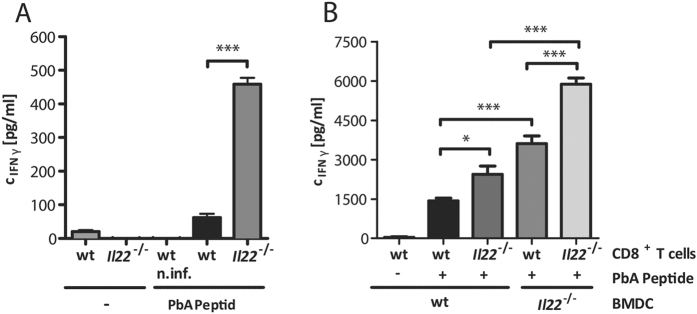
Figure 5. IFNγ secretion of PbA peptide stimulated splenocytes and CD8+ T cells of PbA-infected mice.
Wt and Il22−/− mice were infected with 1 × 10⁵ PbA iRBC. At d6 p.i. mice were sacrificed and the splenocytes were stimulated with 1 μg/mL PbA peptide for 24 h. The IFNγ concentration in the supernatant was analysed with ELISA (nwt; w/o = 4;  ; w/o = 4; nwt n.inf; PbA Peptide = 4; nwt; PbA Peptide = 4; n
 ; PbA Peptide = 4) (A). Wt and Il22−/− mice were infected with 1 × 10⁵ PbA iRBC. At d6 p.i. mice were sacrificed and splenic CD8+ T cells were purified. CD8+ T cells of Il22−/− or wt mice were subsequently incubated on previously PbA peptide pulsed Il22−/− or wt BMDCs. After an incubation time of 24 h the IFNγ concentration in the supernatant was analysed with an ELISA (nwt CD8+; w/o PbA Peptide; wt BMDC = 8; nwt CD8+; PbA Peptide; wt BMDC = 6;
  CD8+; PbA Peptide; wt-BMDC = 6; nwt CD8+; PbA Peptide; Il22−/−
BMDC = 8;
  CD8+; PbA Peptide; Il22−/−
BMDC = 8) (B). Depicted are the means ± SEM.

