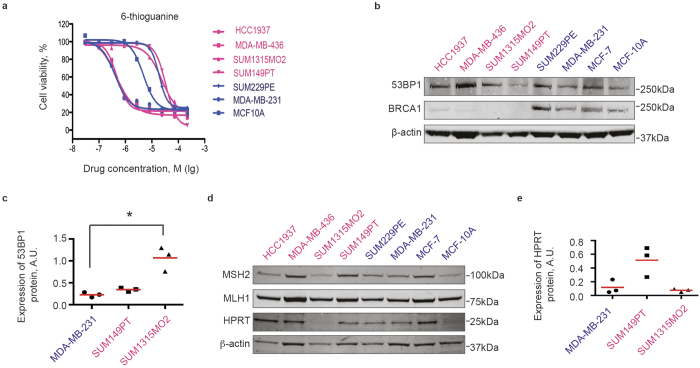
Figure 3. BRCA1-mutant cell lines show distinct sensitivities to 6-thoguanine.
(a) Sensitivity of BRCA1-mutant (red) and BRCA1-wild-type (blue) cell lines to 6-thioguanine was tested in 96-well plates in four replicas using CellTiter-Blue metabolic assay. Each data point represents an average of four replicas. Non-linear regression curves were calculated using GraphPad Prism. (b) Western blot demonstrating that BRCA1-mutant (red) cell lines express full-length 53BP1 protein, but not BRCA1. (c) Quantification of 53BP1 protein expression for select cell lines. Individual normalized band intensity values in arbitrary units (A.U.) from three independent experiments are shown. Red lines show average values for each cell line. Statistical significance was evaluated with the Dunn’s multiple comparisons test following a significant non-parametric Kruskal-Wallis test using GraphPad Prism software. *p < 0,05. (d) Western blot reveals expression of mismatch repair proteins MSH2 and MLH1 in all cells, but lack of the HPRT protein in SUM1315MO2 cell line, likely explaining its resistance to 6-thioguanine. β-actin is used as loading control. (e) Quantification of HPRT protein expression for select cell lines as described in (c).

