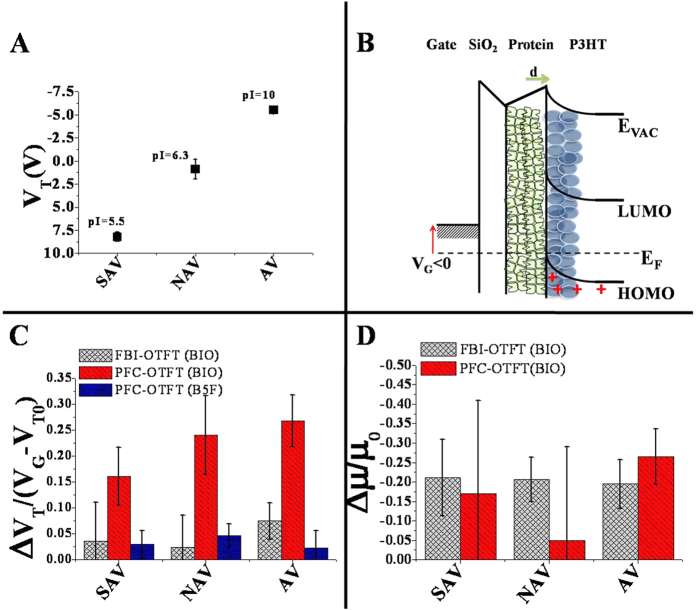
Figure 3. Threshold voltage and field-effect mobility fractional changes.
(A) Threshold voltage (VT) values measured for OTFT devices embedding SAV, NAV and AV. Data are relevant to nine measurements acquired on different devices and are reported as the average value along with the relevant RSDs. (B) Band diagram of an OTFT embedding the protein layer underneath the OSC, upon application of a negative gate bias that drives the transistor in the accumulation mode. (C) Fractional changes of the threshold voltage evaluated for the FBI configuration upon exposure to 1 ppb of Biotin and for the PFC configuration upon exposure to 1 ppb of Biotin and B5F. (D) Fractional changes of the field-effect mobility evaluated for the FBI and PFC configurations upon exposure to 1 ppb of Biotin.

