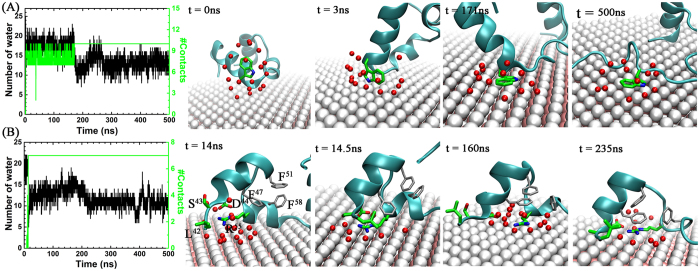
Figure 5.
Surface adsorption dynamics for key residues, Trp-64 (A) and Arg-55 (B). Left panel: time-profiles for heavy atom contact (green curve) between the sidechain and MoS2, and water number in the FSS of the selected residues (black curve). Right panels: representative snapshots for key intermediate states along the adsorption process. The selected residues (64W and 55R) are depicted by sticks marked in green (carbons) and blue (nitrogens), and nearby residues (47F, 51F and 58F) by gray sticks. Water in FSS are depicted with red spheres. Other schemes are same as those used in Fig. 1.

