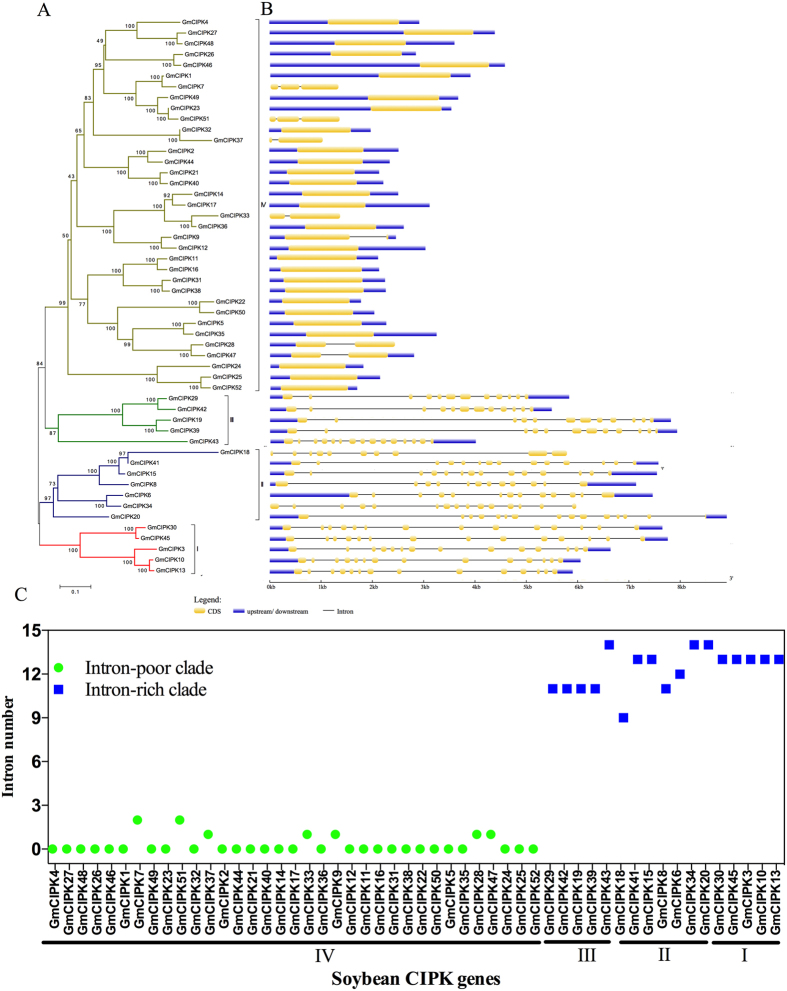
Figure 1. Phylogenetic relationship of soybean CIPK proteins and gene structure.
The phylogenetic tree was generated using the MEGA6.06 software with the 52 full-length soybean CIPKs protein sequences (A). Neighbor-joining method was used with 1000 bootstrap replicates. These soybean CIPK genes were divided into four subgroups (I–IV) with different colored branches. Exon and intron analysis was performed using GSDS2.0 (B). The yellow boxes represent exons and the black lines represent introns. The blue boxes represent upstream/downstream-untranslated regions. The scale bars of introns, exons and untranslated regions are included at the bottom of the graph. (C) Classification of CIPK genes into intron-poor clade (green dots) and intron-rich clades (blue squares). Genes with intron number less than 3 were grouped into the intron-poor clade, and genes with intron number more than 8 were grouped into the intron-rich clade.

