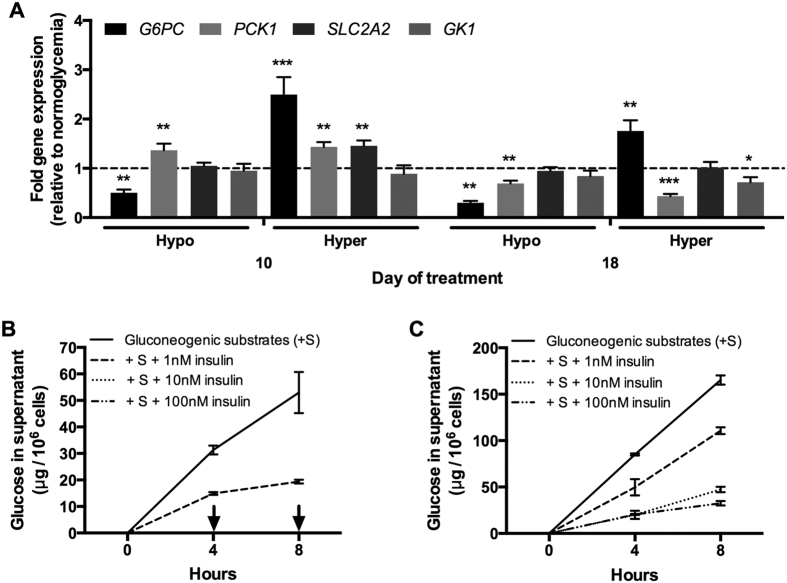
Figure 4. Glucose-induced modulation of glucose metabolism pathways and insulin sensitivity in MPCCs.
(A) Levels of glucose-6-phosphatase catalytic subunit (G6PC), phosphoenolpyruvate carboxykinase-1 cytosolic (PCK1), glucose transporter 2 (SLC2A2) and glycerol kinase (GK1) mRNA transcripts in MPCCs treated with hypo- and hyperglycemic culture media for 10 or 18 days. Data is normalized to a normoglycemic control. (B) Glucose output in supernatants of normoglycemic MPCCs (10 days of treatment) treated with gluconeogenic substrates (20 mM lactate and 2 mM pyruvate) in the presence or absence of different levels of insulin (see methods for additional details). Arrows indicate no detectable glucose in supernatants. (C) Glucose output as in panel (B) except hyperglycemic MPCCs were used. Error bars represent SD. *p≤ 0.05, **p ≤ 0.01, and ***p ≤ 0.001. Similar results were observed in another primary hepatocyte donor.

