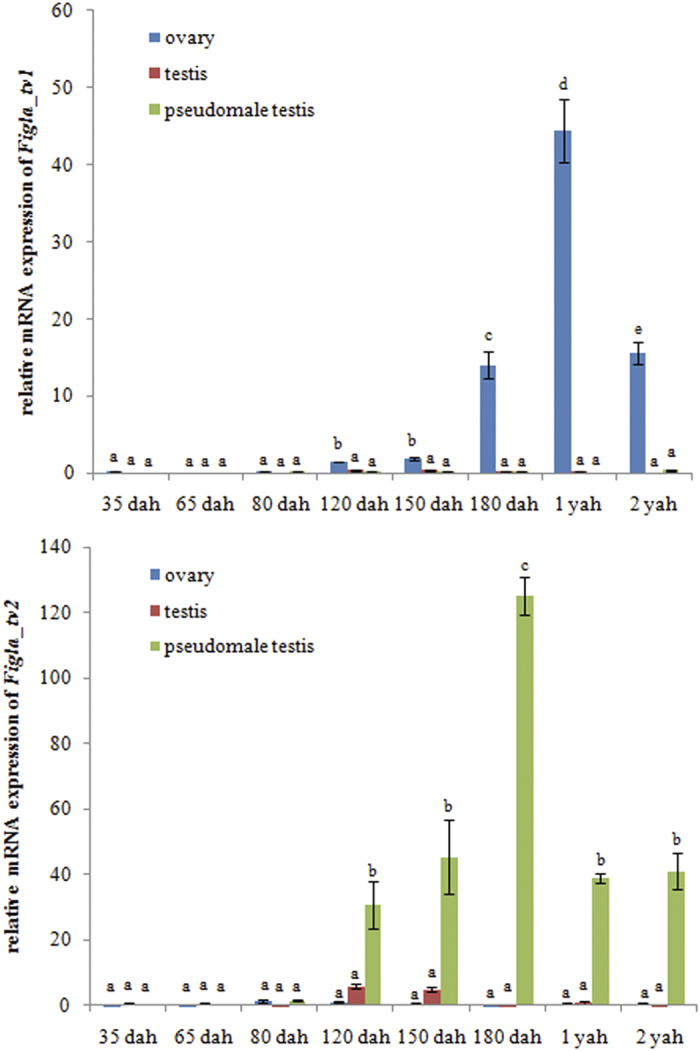
Figure 4. Relative expression levels of Figla_tv1 and Figla_tv2 at different development stages in gonads of C. semilaevis.

The expression level was normalized using the geometric mean of the levels of two internal control genes (β-actin and Rpl13α). The mean ± SEM values from three separate individuals (n = 3) are shown. Bars with different letters indicate statistically significant differences (P < 0.05).
