
Figure 6. Relative mRNA expression levels of Figla_tv2, StAR and P450scc in cultured pseudomale gonad cells after RNAi treatment.
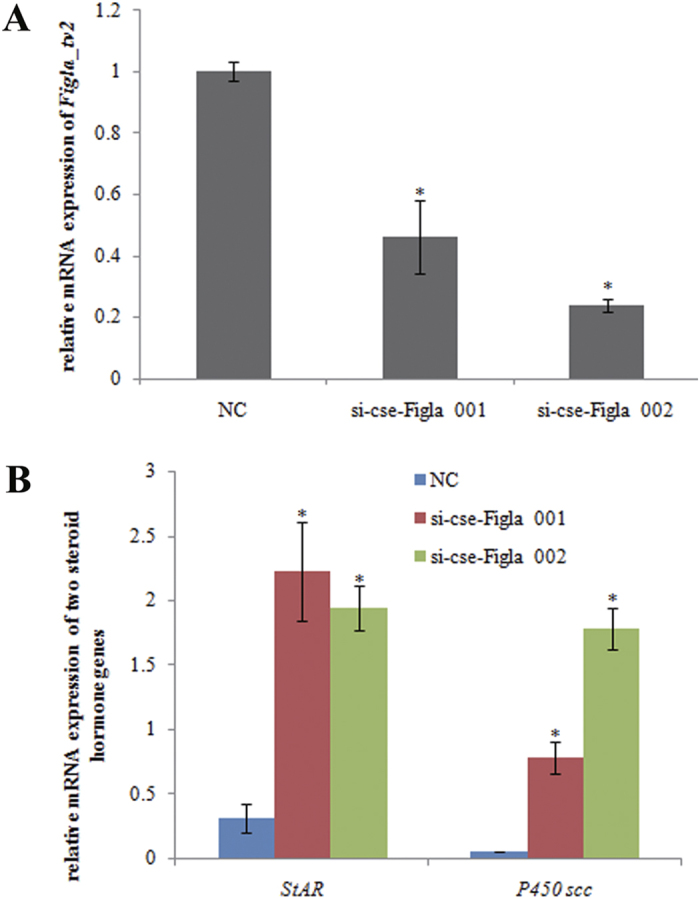
(A) Expression of Figla_tv2 after the transfection of the siRNAs for 48 h. (B) Expression of StAR and P450scc after the transfection of the siRNAs for 48 h. The transcripts of the β-actin and Rpl13α genes were used as internal controls to normalize the expression. NC, si-cse-Figla 001 and si-cse-Figla 002 indicate the gonad cells transfected with the siRNAs of the negative control (NC), si-cse-Figla 001 and si-cse-Figla 002, respectively. Asterisks above the bars indicate significant differences (P < 0.05) between the treated group and the control.