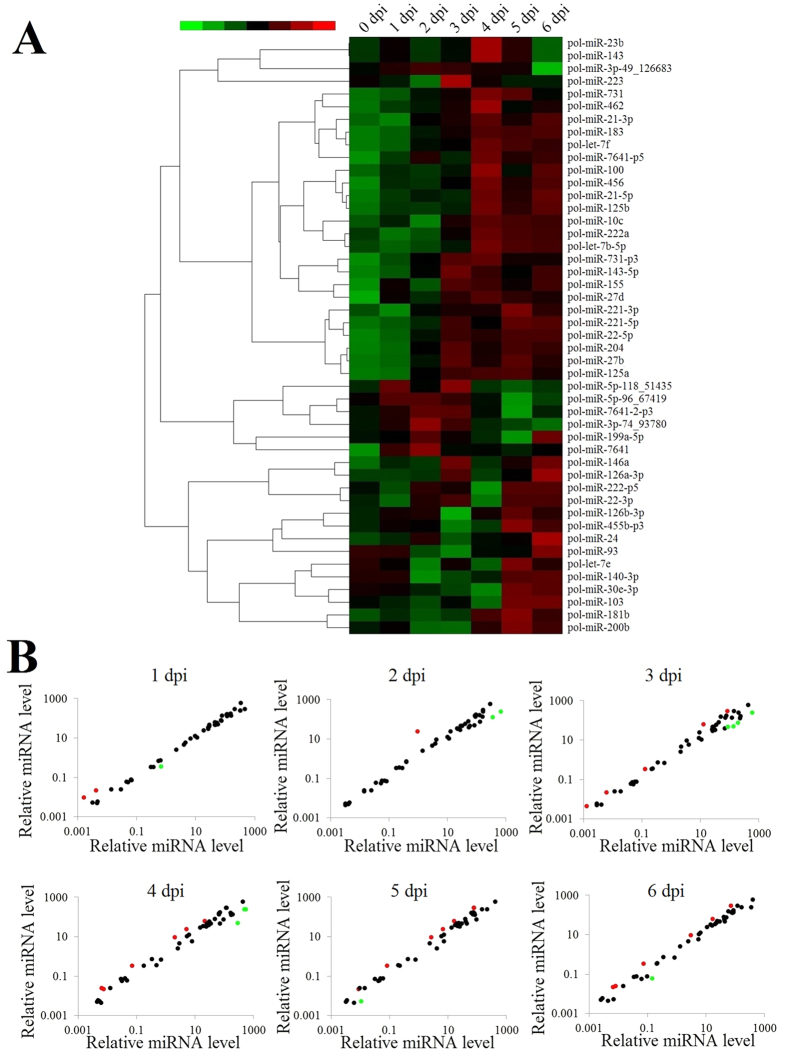
Figure 1. Expression profiles of flounder miRNAs during the early stage of megalocytivirus RBIV-C1 infection.
(A) Expression levels of 47 flounder miRNAs at 0–6 days post-viral infection (dpi) are shown in different colors. Each horizontal color bar represents one miRNA, with the name indicated on the right of the bar. (B) Scatter plot of expression levels of 47 flounder miRNAs at 1-6 dpi compared with 0 dpi. Red and green spots represent miRNAs that were significantly (P < 0.01 and >2 fold) upregulated and downregulated, respectively (the names of these miRNAs are indicated in Table S1).

