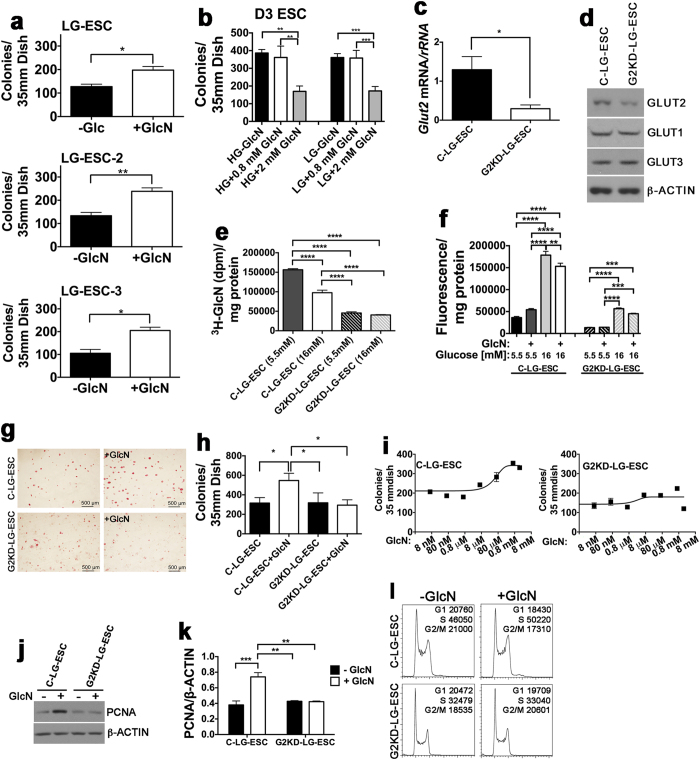
Figure 1. GLUT2-mediated GlcN transport stimulates ESC proliferation.
(a) Alkaline phosphatase-positive (AP+) colonies following culture for 4 days ± 0.8 mM GlcN of 3 different LG-ESC lines (LG-ESC, LG-ESC-2, and LG-ESC-3) that were derived from 3 different FVB blastocysts in low glucose media. (b) AP+ D3 ESC colonies following culture for 4 days in media containing either 5 or 25 mM glucose ±0.8 or 2 mM GlcN. (c) RT-PCR of Glut2 (Slc2a2) mRNA normalized to rRNA from control LG-ESC (C-LG-ESC) and Glut2 knockdown (G2KD-LG-ESC) transfected with shRNA plasmids as described in Methods. (d) Immunoblot of GLUT2, GLUT1 (SLC2A1), GLUT3 (SLC2A3), and β-ACTIN from C-LG-ESC and G2KD-LG-ESC. (e) Transport of 0.8 mM 3H-GlcN by C-LG-ESC and G2KD-LG-ESC in the presence of 5.5 mM or 16 mM glucose. (f) Transport of 5.5 or 16 mM 2-deoxy-D-glucose containing the fluorescent 2-deoxy-D-glucose analog, 2-NBD-glucose, by C-LG-ESC and G2KD-LG-ESC ± 0.8 mM GlcN. (g) AP staining of C-LG-ESC and G2KD-LG-ESC cultured ± 0.8 mM GlcN. Scale bar = 500 μm. (h) Quantitation of AP+ colonies. (i) Numbers of AP+ C-LG-ESC and G2KD-LG-ESC colonies in response to 8 nM-8 mM GlcN. (8 mM GlcN was toxic to both cell lines.) (j) Immunoblot of PCNA from C-LG-ESC and G2KD-LG-ESC cultured ± 0.8 mM GlcN. (k) Quantitation of PCNA/β-ACTIN from triplicate culture dishes. (l) Flow cytometry analysis by C-LG-ESC and G2KD-LG-ESC cultured ± 0.8 mM GlcN. The total numbers of cells in G1, S and G2/M from three replicate columns are indicated. Experiments were repeated 2–3 times using triplicate culture dishes. Quantitative data from representative experiments are displayed as the mean ± s.e.m. (N = 3) and were analyzed by Student t-test (a,c) one-way ANOVA followed by Tukey’s post test (b,e,h,k), two-way ANOVA followed by Tukey’s post test (f), nonlinear regression (i) or chi-square (l). *P < 0.05; **P < 0.01; ***P < 0.001; ****P < 0.0001.

