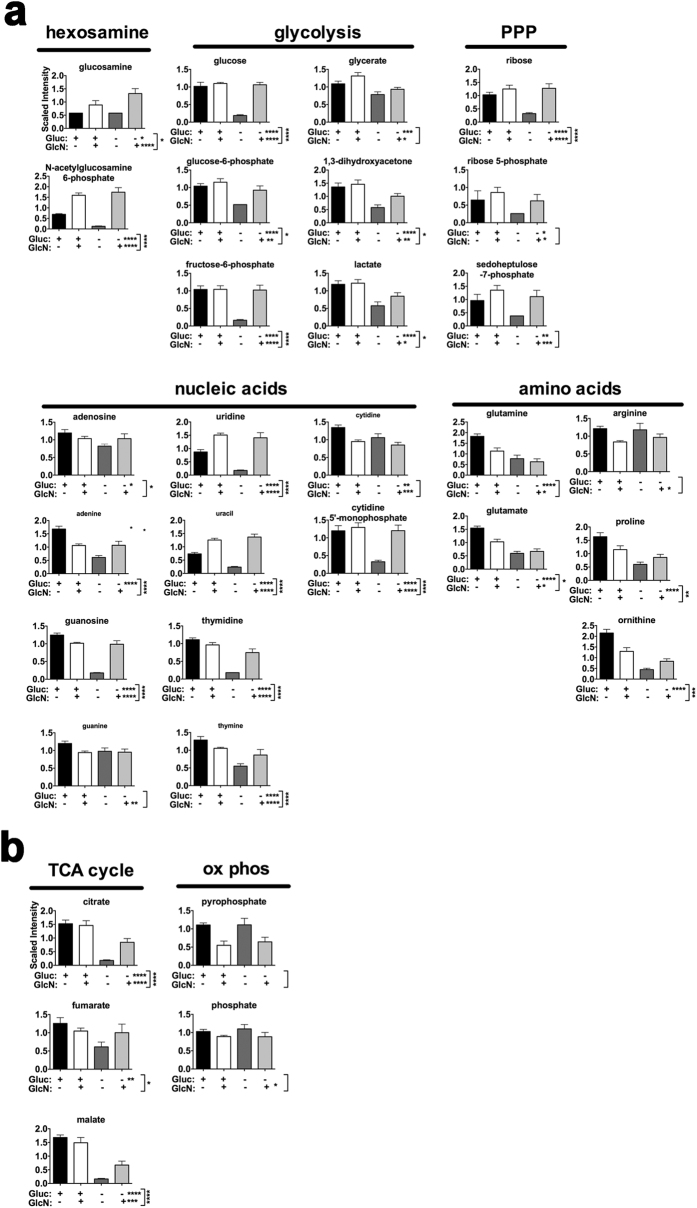
Figure 5. GlcN effects on metabolic profiles.
(a) Metabolites of anabolic pathways supplied by glucose or glutamine. (b) Metabolites of energy production (TCA cycle or oxidative phosphorylation) fueled by glucose or glutamine. LG-ESC were grown in low glucose media ± 0.8 mM GlcN for 47 h, and then half of the dishes were replaced with the same media and half were replaced with 0 glucose media ± 0.8 mM GlcN (24 plates total, 6 per treatment group) for 1 additional hr of culture. Methods for metabolic profiling, metabolite identification, and data analysis are described in the Supplementary Methods. Statistical analysis of log-transformed data was performed using “R” (http://cran.r-project.org/). Data (mean ± s.e.m., N = 6) were analyzed by two-way ANOVA to determine main effects of glucose (Gluc), GlcN, and Gluc:GlcN interaction. Multiple comparisons were accounted for by estimating the false discovery rate (FDR) using q-values. *q < 0.05, **q < 0.01, ***q < 0.001, ****q < 0.0001. (q values of Gluc:GlcN interactions are shown next to vertical brackets.) Detailed quantitation and results of statistical analyses are shown in Supplementary Table 2.

