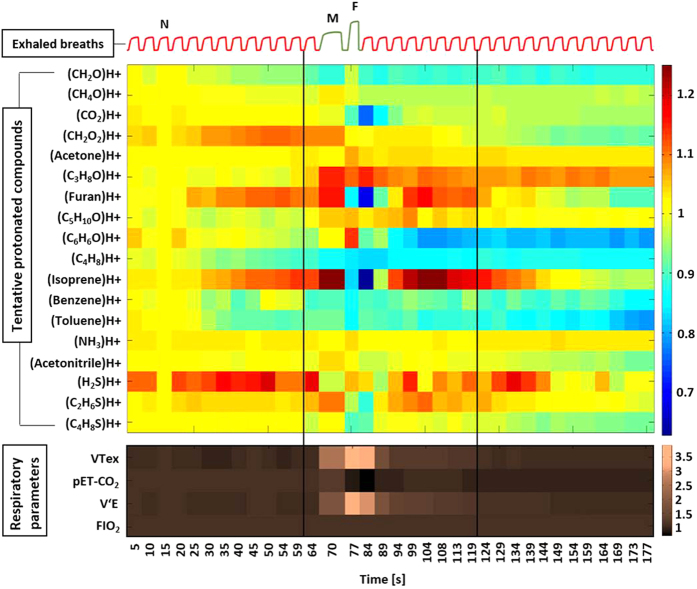
Figure 1. Relative changes in normalized alveolar concentrations of 18 selected compounds and respiratory parameters from 50 healthy volunteers.
A schematic spirogram profile of exhaled breaths is presented on the top of the figure. Protonated compounds were tentatively identified based on their m/z ratio. VOC concentrations and respiratory parameters were normalized onto values in the third exhalation (‘N’). The beginning and the end of the second minute is represented by two vertical black lines. FEV manoeuvre was performed at the beginning of 2nd minute. During the manoeuvre the maximum exhalation point is marked as ‘M’ and the forced expiration point is marked as ‘F’. VTex = expiratory tidal volume, pET-CO2 = end-tidal partial pressure of carbon dioxide, VE = minute ventilation and FIO2 = fraction of inspiratory oxygen.

