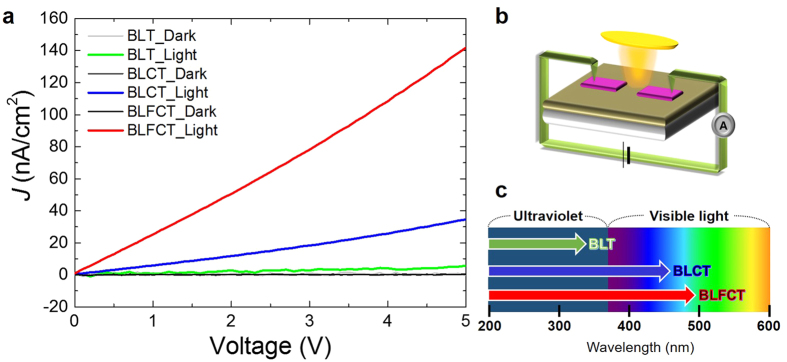
Figure 5. Photovoltaic responses of the BLT, BLCT, and BLFCT films.
(a) The photocurrent density (J) of the BLT, BLCT, and BLFCT films on STO (001). The dark current of the BLT, BLCT, and BLFCT films (grey, dark grey, and black). The light current of the BLT film (green). The light current of the BLCT film (blue). The light current of the BLFCT film (red). (b) The schematic of the photocurrent measurement. The ITO electrodes were deposited on the films, and J was measured between the two electrodes. (c) The schematic of the light wavelength range that the BLT, BLCT, and BLFCT films can absorb, which is predicted using the bandgap data.

