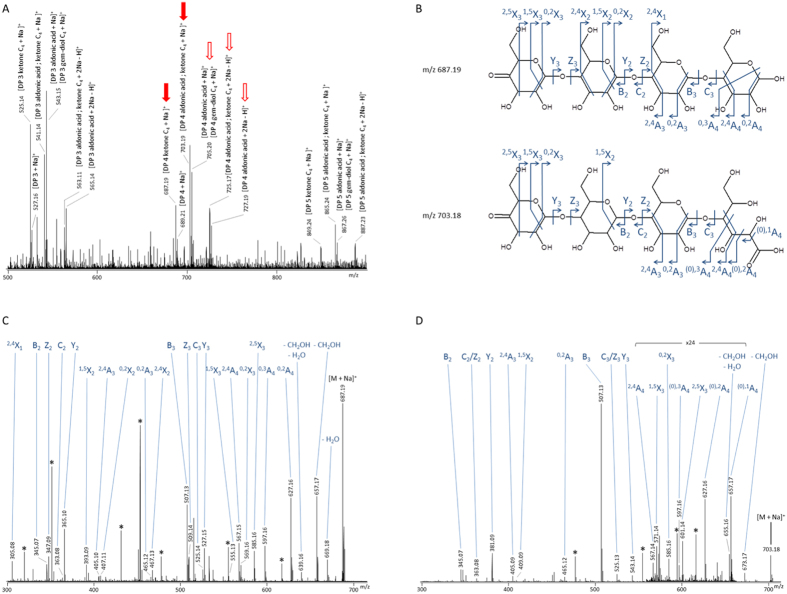
Figure 4. Mass spectrometry analysis of degradation products generated from PASC by PaLPMO9H with GDH and glucose as described in Fig. 3.
Analyses were performed after 24 hours of cellulose degradation. Panel (A) shows MS spectrum of sample with peaks corresponding to native and oxidized cello-oligosaccharides. Peaks that were further fragmented are indicated by arrows. Panel (B) shows MS/MS spectrum of the 687 m/z species which corresponds to a C4-oxidized product (ketone form). Panel (C) shows MS/MS spectrum of the 703 m/z species which corresponds to a double oxidized product (ketone form on C4 and aldonic acid form on C1). Observed fragments are depicted on structures in panel (D). Black stars: unassigned fragments.

