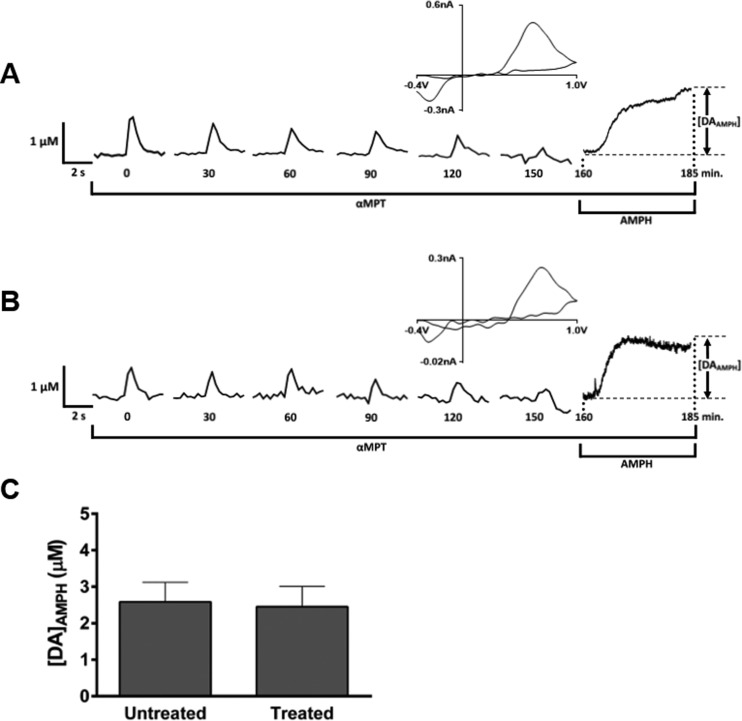
Figure 4.
Quantitation of reserve pool DA. Representative raw data traces of reserve pool content analysis in brain slices from (A) saline-treated and (B) carboplatin-treated (20 mg/kg) rats. For a typical measurement, slices were continuously exposed to αMPT, a tyrosine hydroxylase inhibitor, to block DA synthesis. Electrically evoked DA release was measured every 5 min until the signal diminished (occurring at 150 min in the data shown). Traces are shown here every 30 min for clarity. The addition of AMPH then caused the efflux of reserve pool DA. The cyclic voltammogram (upper right of each trace) confirms the presence of DA at the peak of the AMPH-induced efflux. (C) Bar graph representing the average of the [DA]AMPH measurements (p > 0.05, n = 5 rats per group).

