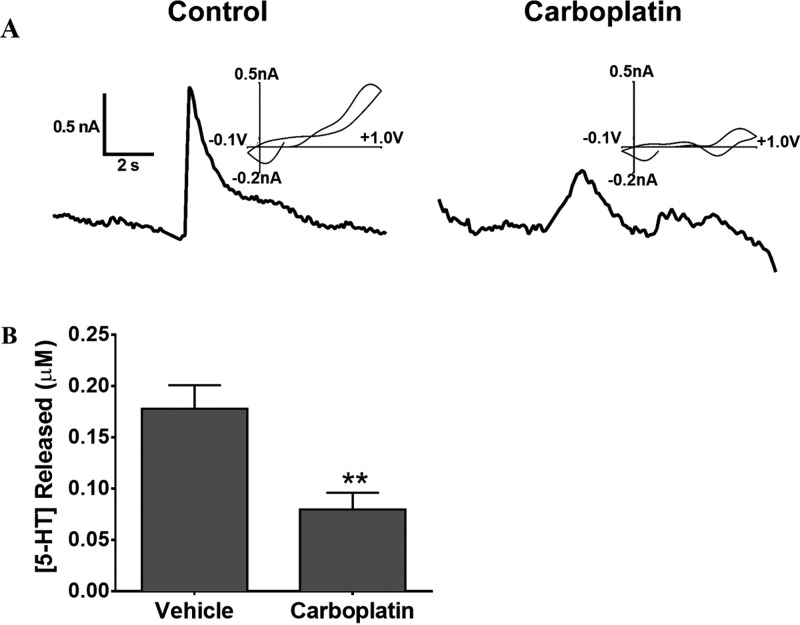
Figure 5.
Serotonin release impairment in carboplatin-treated rats. (A) Representative plots of stimulated 5-HT release. Cyclic voltammograms above the stimulated release plots confirm the presence of 5-HT. (B) Bar graph showing attenuation of peak 5-HT release in 20 mg/kg carboplatin-treated rats (45% compared to saline-treated controls) (**p < 0.01, n = 5 rats per group).

