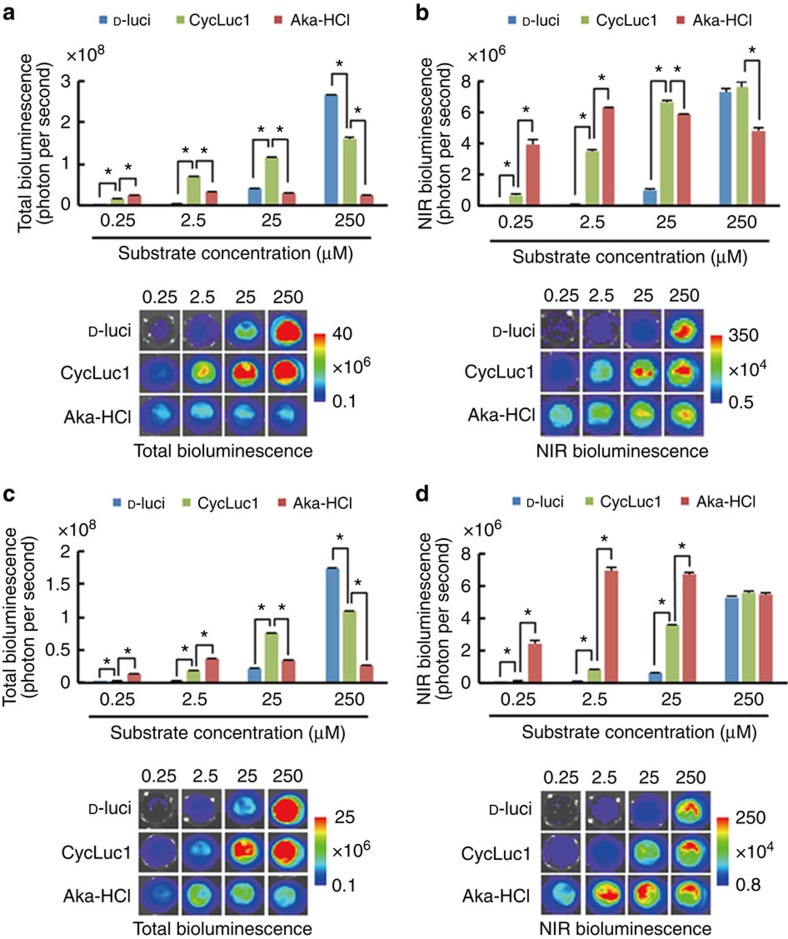
Figure 2. Cellular imaging using AkaLumine-HCl.
Substrate dose dependency of total (a,c) or NIR (b,d) bioluminescence production in LLC/luc (a,b) or MDA-MB-231/luc (c,d) cells. The cells (4 × 10⁵ cells per well) were treated with the substrate at indicated concentrations. Images were acquired with 680±10 nm emission filter (right panels) or without a filter (left panels), to measure NIR bioluminescence or total bioluminescence signals, respectively. n=3, *P<0.05 (t-test). Error bars indicate s.e.m.

