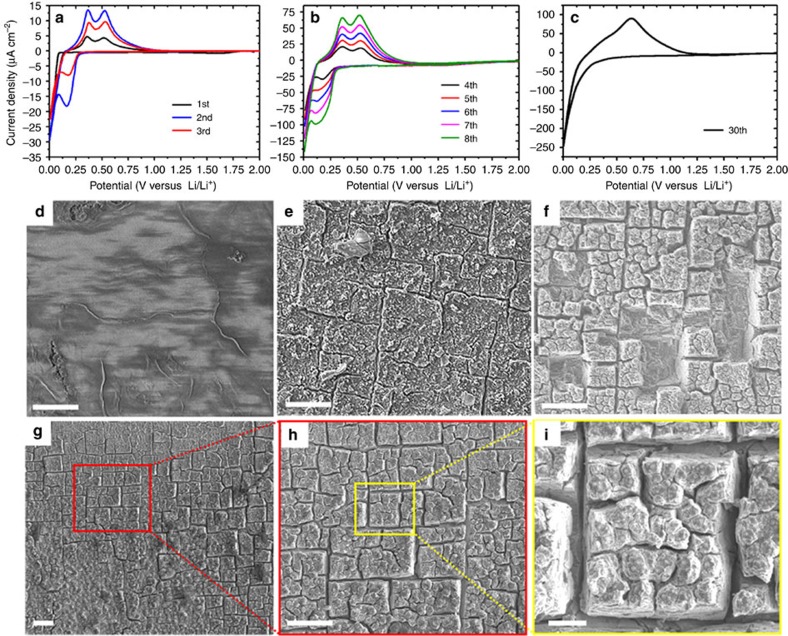
Figure 1. Electrode cyclic voltammetry response and surface morphology.
Current–voltage curves of a Si(100) electrode cycled between 2.0 and 0.01 V at a scan rate of 0.1 mV s−1 for (a) 1–3, (b) 4–8 and (c) 30 successive lithiation/delithiation cycles. Top-view scanning electron microscope images of electrode surface morphology obtained after (d) 3, (e) 8, (f) 50 and (g–i) 30 cycles. Scale bar, 20 μm (d–h); 3 μm (i).

