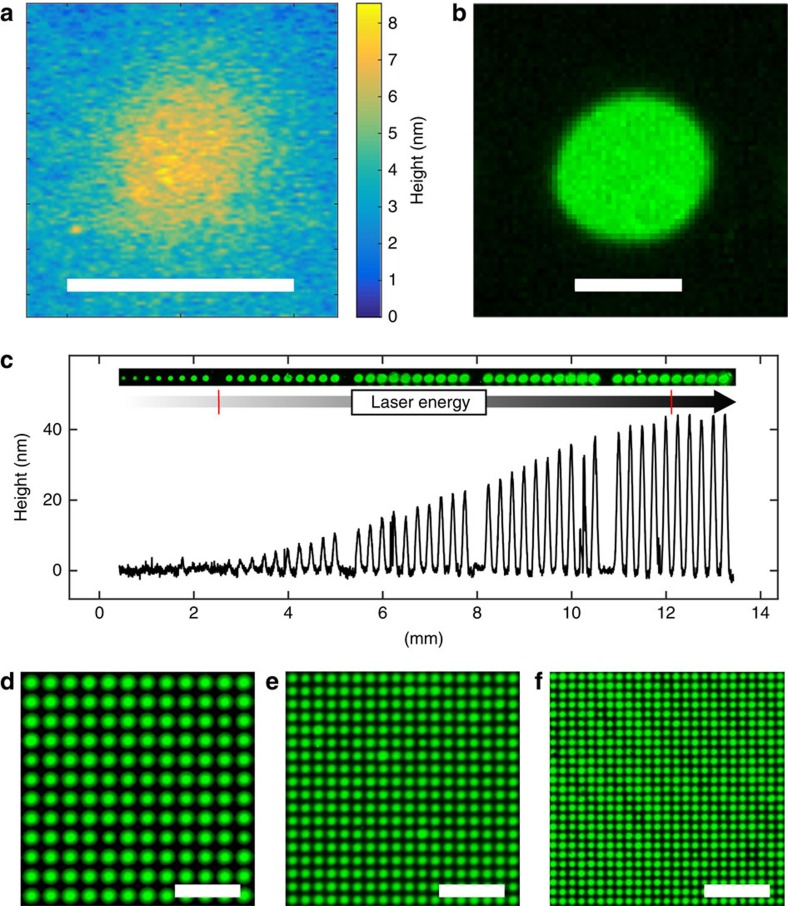
Figure 3. Analysis of transferred spots and spot resolution.
(a) Topography of the spot with activated leucine monomers in the polymer matrix on the acceptor slide before the coupling and washing steps, measured with phase-shift interferometry. The material spot is ∼8 nm thick at its centre (scale bar, 100 μm). (b) The fluorescence image of the spot after coupling of the monomers and staining with a rhodamine dye. The amount of the transferred material is ∼0.1 ng (scale bar, 100 μm). (c) Topography of transferred spot material in dependence of the laser energy. The height of the transferred spot material, containing an activated leucine building block, was measured with phase-shift interferometry, laser energy linearly increases from left to right in steps of ∼15 μJ. The range of the linear correlation of deposited material (1–50 nm) and deposited laser energy (450–900 μJ) is marked by red lines. The corresponding fluorescence staining pattern of the coupled leucine was obtained with a rhodamine dye. (d–f) Fluorescence images of biotin patterns (scale bar, 500 μm), stained with labelled streptavidin, achieving different pitches: (d) 150 μm (4,444 spots per cm2), (e) 100 μm (10,000 spots per cm2), (f) 75 μm (17,777 spots per cm2).

