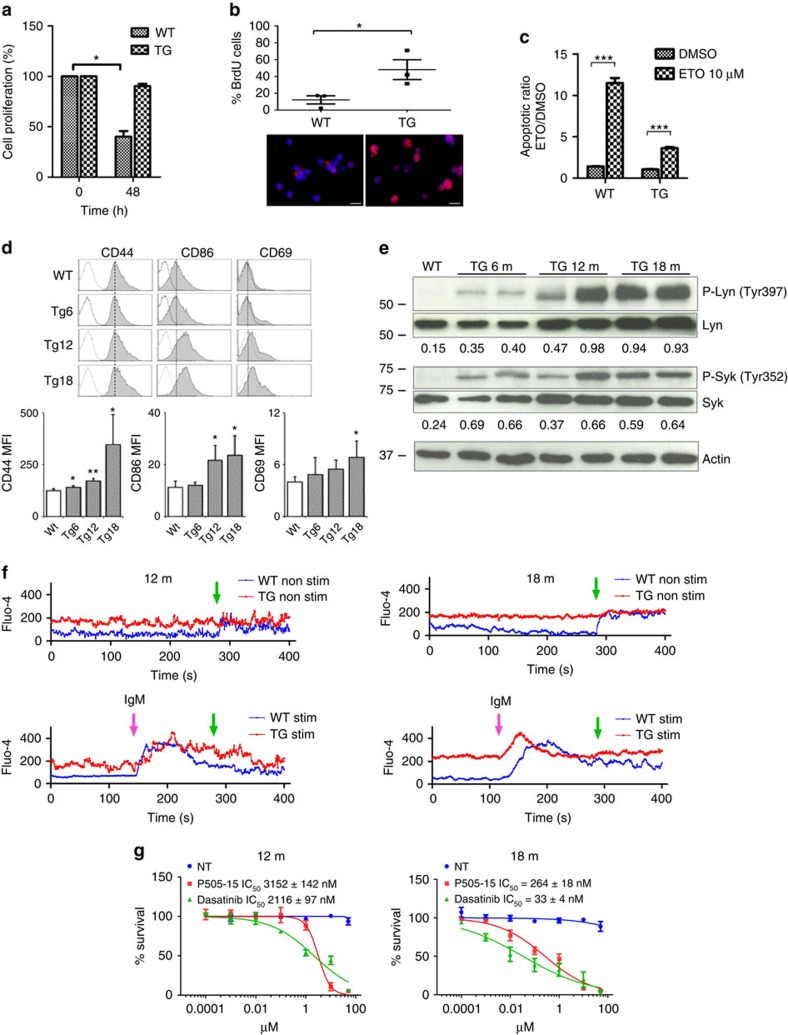
Figure 4. NKX2-3 induces B-cell receptor signalling in B cells from young mice.
(a) Cell survival of in vitro cell cultures containing isolated CD19+ cells from WT and transgenic (TG) mice. Data from three experiments are shown. (b) BrdU staining of WT and TG splenic CD19+ cells isolated after 20 h of BrdU administration. A representative merged DAPI (blue) and BrdU (red) staining image is shown (bottom). Results of BrdU quantification in WT and TG mice are shown (top). Scale represents 10 μm in all cases. (c) Apoptosis quantification after 48 h of incubation with etoposide (ETO) or dimethylsulphoxide (DMSO) in B cells from WT and NKX2-3 TG mice. Data from three experiments are shown. Error bars represent standard deviation (s.d.). The statistical significance levels of the changes are indicated (two-tailed Student's t-test: *** P<0.0001). (d) Top, Representative flow cytometry profiles (grey filled histogram) of the indicated molecules at the surface of WT B cells and NKX2-3 TG B cells of the specified ages (Tg6, 6-month-old mice, Tg12, 12-month-old mice and Tg18, 18-month-old mice). Dashed black line, maximum expression levels in WT B cells. Dotted histogram, isotype control. Bottom, quantification of the mean fluorescence intensity (MFI) for CD44, CD86 and CD69 surface expression in WT and Tg B cells of the indicated ages; data are the mean±s.d. (n=3 mice in each case). (e) Western blot analysis showed increased phosphorylation levels of Syk and Lyn kinases in CD19+ splenic B cells isolated from TG mice at 6, 12 and 18 months. Quantification of phosphorylated Lyn and Syk proteins was determined by densitometry, indicating the ratio respect to the non-phosphorylated form. (f) Kinetics of calcium mobilization in splenic B cells from WT and TG NKX2-3 mice at 12 and 18 months. Top and bottom graphs show the kinetics of non-stimulated and stimulated cells with goat anti-mouse IgM, respectively. Pink arrows indicate the time points of the stimulation (stim.), whereas green arrows indicate the time points of addition of Ca2+-containing buffer. (g) Survival of splenic Eμ-NKX2-3 CD19+ B-cell lymphoma cell cultures incubated with the Syk and Lyn protein inhibitors (P505-15 and Dasatinib, respectively) at increasing concentrations. Non-treated cells (NT) were incubated with DMSO. IC50, half maximal inhibitory concentration. Error bars indicates s.d.

