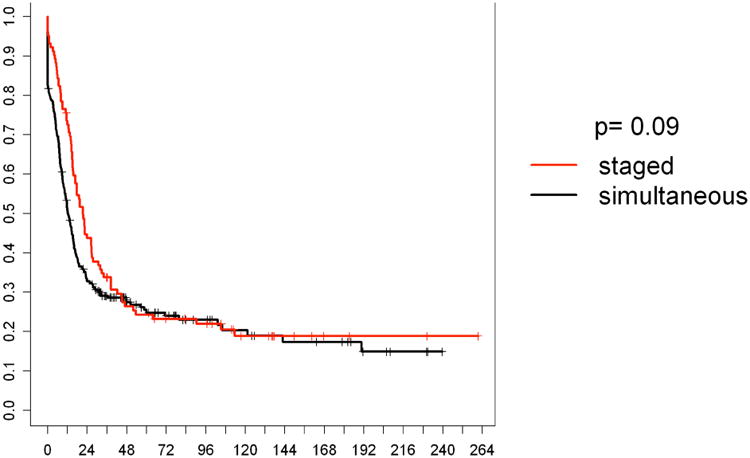
Figure 3.

Disease free survival according to treatment strategy. Staged: staged resected patients (n=109); simultaneous: simultaneously resected patients (n=320).
X-axis represents percentages of surviving patients. Y-axis represents survival in months.
