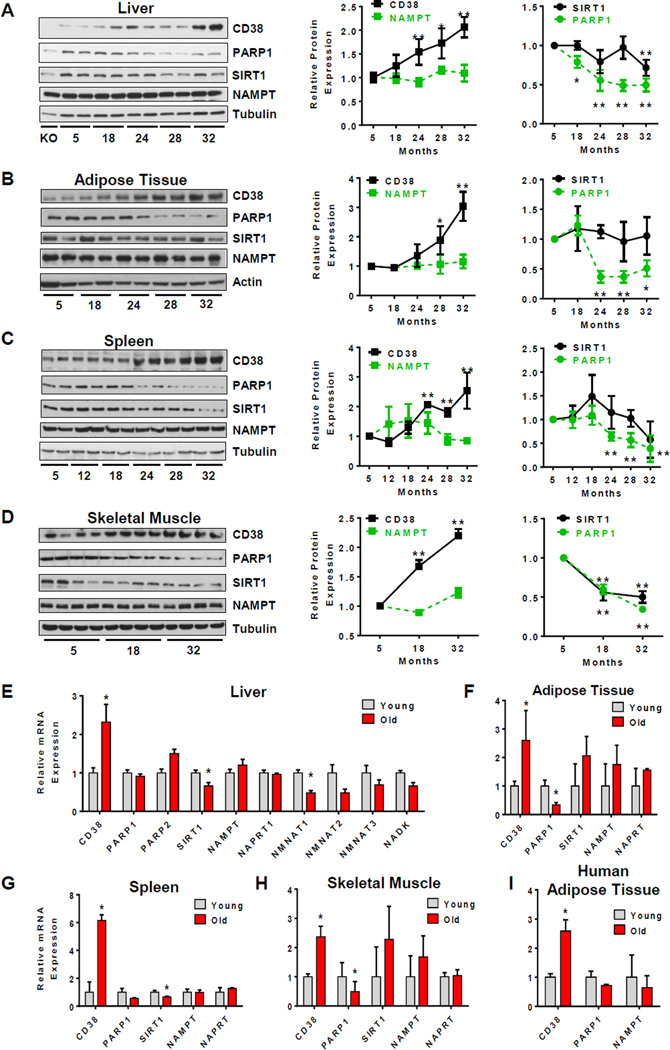
Figure 1. CD38 expression increases with aging.
(A) Immunoblots for CD38, PARP1, SIRT1, NAMPT and Tubulin in mice liver (left). On the right, graphs show relative protein expression of SIRT1, PARP1, CD38 and NAMPT. Relative expression of each protein was calculated as a ratio to Tubulin levels in each lane, and then calculated relative to 5 month old mice (n=12 for each age, *p<0.05, **p<0.01). In the experiments of Figure 1 A–H animals were obtain from the NIA aging colony.
(B–D) Immunoblots for CD38, PARP1, SIRT1, NAMPT and Tubulin in mice adipose tissue (B), spleen (C), and skeletal muscle (D) (left). On the right, graphs show relative protein expression of SIRT1, PARP1, CD38 and NAMPT in the tissues. Relative expression of each protein was calculated as a ratio to Tubulin in each lane, and then calculated relative to 5 month old mice (n=4–6 for each age, *p<0.05, **p<0.01).
(E) Relative mRNA levels of CD38, PARP1, PARP2, SIRT1, NAMPT, NAPRT1, NMNAT-1, NMNAT-2, NMNAT-3 and NADK in liver of young and old mice (3 and 32 months of age, respectively). (n=4 animals for each age, *p<0.05, versus 3 month old mice).
(F–H) Relative mRNA levels of CD38, PARP1, PARP1, SIRT1 NAMPT, and NAPRT1 in adipose tissue (F), spleen (G), and skeletal muscle (H) (3 and 32 months of age, respectively) (n = 4 animals for each age, *p <0.05, versus 3 month old mice).
(I) Relative mRNA levels of CD38, PARP1, and NAMPT in omental adipose tissue of human subjects with average ages of 34 (young) and 61 (old) (n = 9 for each age, *p <0.05, versus young group).
All values are mean ± SEM.

