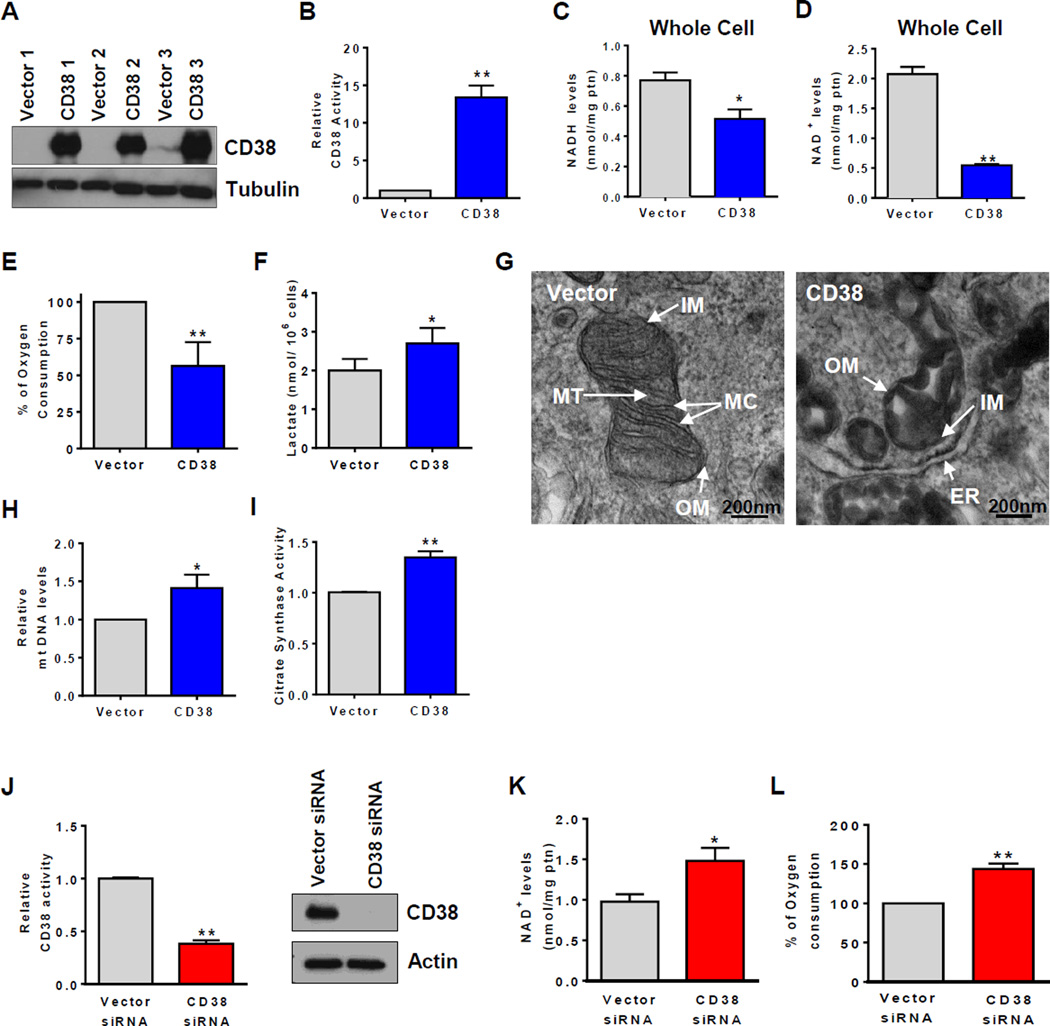
Figure 4. Changes in CD38 expression regulate NAD+ levels and mitochondrial function in cells.
293T cells expressing vector or Flag. CD38 were used in experiments from (A–L) and A549 cells were used in (M–O). All values are mean ± SEM. *p<0.05, **p<0.01, compared to control cells.
(A) Immunoblotting for CD38 and Tubulin.
(B) CD38 NADase activity (n=5).
(C) and (D) Total NAD+ and NADH levels in whole cells (n=5).
(E) Mitochondrial oxygen consumption in intact cells. Histogram represents the % oxygen consumption under FCCP-induced maximum respiration (n=6).
(F) Lactate released in media (n=5).
(G) Transmission electron microscopy. Scale bar: 200nm. OM: outer membrane, IM: internal membrane, MT: mitochondrial matrix, MC: mitochondrial cristae, ER: endoplasmic reticulum.
(H) Relative mtDNA quantification (n=4).
(I) Citrate synthase activity (n=9).
(J) CD38 NADase activity (n=5) and immunoblotting for CD38 and Tubulin.
(K) Total NAD+ levels (n=5).
(L) Routine oxygen consumption (n=3).

