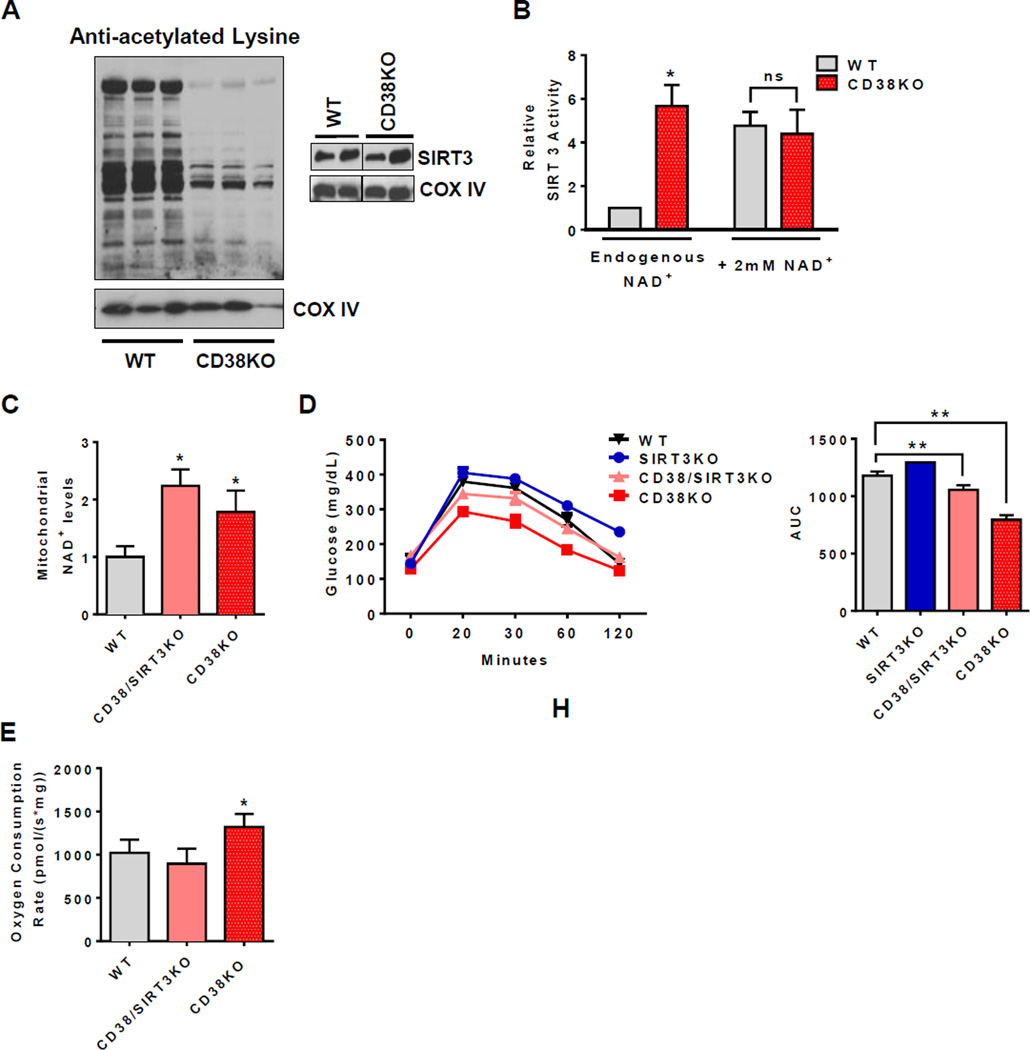
Figure 5. CD38 controls the metabolic response in aged mice by activating SIRT3-dependent mechanisms.
All values are mean ± SEM. (A) Mitochondrial protein acetylation profile (upper panel) and immunoblotting for SIRT3 in one year old WT and CD38KO litter mate mice (lower panel). Each lane represents one independent mouse.
(B) SIRT3 activity in liver mitochondria isolated from one year old WT and CD38KO litter mate mice with endogenous contaminant NAD+ or addition of a saturating dose of 2mM NAD+ (n=4, *p<0.05, ns= non-significant p>0.05 versus WT control).
(C) NAD+ levels in isolated liver mitochondria from two year old litter mate WT, CD38KO, and CD38/SIRT3KO mice (n=6, *p<0.05 versus WT mice).
(D) Glucose concentration in (F) two year old litter mate WT, SIRT3KO, CD38KO, and CD38/SIRT3KO mice after intraperitoneal injection of glucose (left graphs). Area under the curve for glucose concentrations in different mice (right graphs) (n=8, **p<0.01, *p<0.05 versus WT mice).
(E) Oxygen consumption rates coupled to ATP synthesis in liver mitochondria isolated from two year old litter mate WT, CD38KO, and CD38/SIRT3KO mice (n=6, *p<0.05, versus WT mice).

