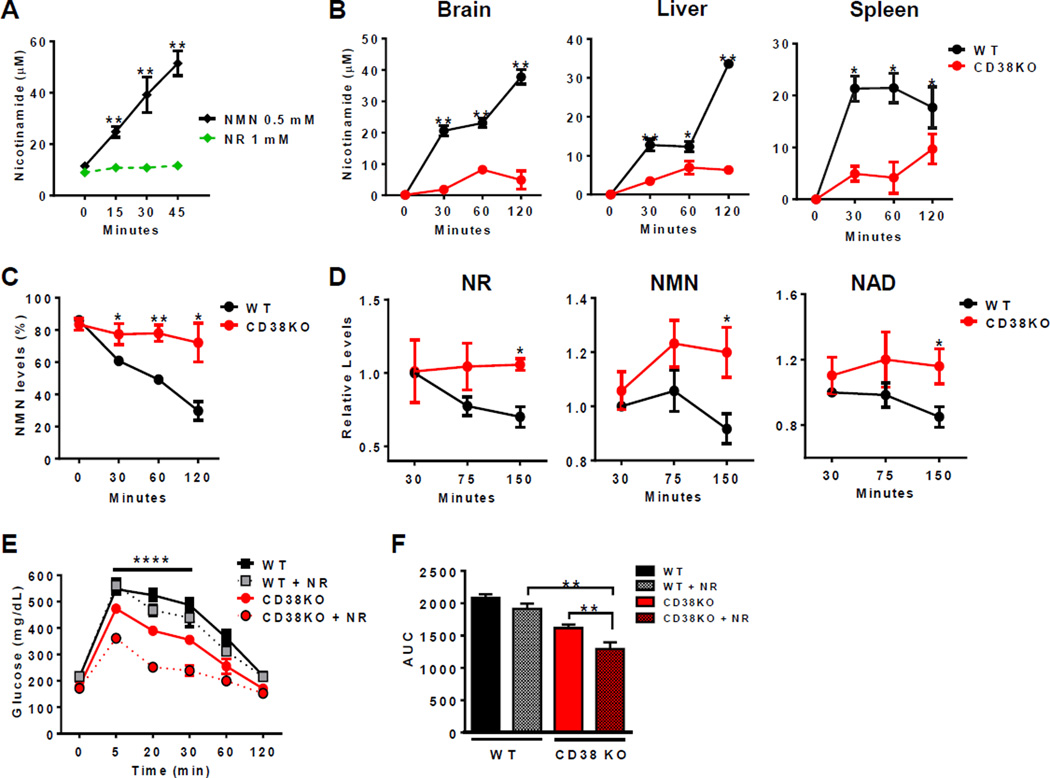
Figure 6. CD38 regulates the NR-induced metabolic improvement in high fat diet.
All values are mean ± SEM.
(A) Nicotinamide concentration in vitro after incubation of 1mM NR or 0.5mM NMN with CD38 recombinant protein. The metabolites were measured by HPLC (n=3, **p<0.01 versus NMN incubation).
(B) Nicotinamide concentration in different tissue homogenates from WT and CD38KO mice after incubation with 1mM NMN. The metabolites were measured by a coupled assay (n=3,*p<0.05, **p<0.01 versus WT mice).
(C) Nicotinamide concentration in blood from WT and CD38KO mice after incubation with 1mM NMN. The metabolites were measured by HPLC (n=3, *p<0.05, **p<0.01 versus WT mice).
(D) Levels of NR, NMN, and NAD in blood of WT and CD38KO mice after injection of 500mg/kg NR intraperitoneally (i.p.). The metabolites were measured by HPLC (n=3, *p<0.05 versus WT mice). Due to the technique use it is possible that the NR peak in the figure could contain other metabolites.
(E and F) Glucose concentration in WT and CD38KO mice after 16 weeks of high fat diet, treated with 500mg/Kg of Nicotinamide Riboside (NR) (dotted line) i.p. The controls received PBS injection (solid line) (E). Two-way ANOVA and Bonferroni's post-test with repeated measures show significant interaction between the glucose curve for CD38KO and CD38KO + NR (****p<0.0001). (F) Quantification of glucose AUC (**p<0.01, n=10).

