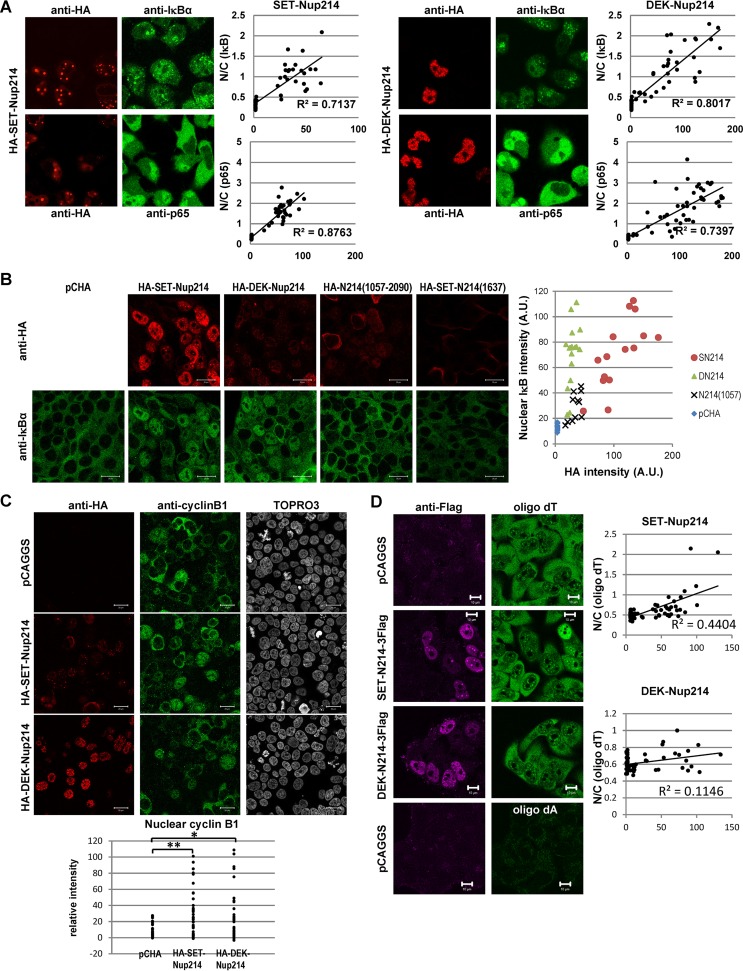
FIG 3.
Localization of endogenous proteins harboring the NES and mRNA. (A) (Images) HeLa cells were transiently transfected with pCHA-SET-Nup214 or HA-DEK-Nup214 and were subjected to IF assays using anti-HA (clone 3F10), anti-IκBα (C-21; dilution, 1:100; Santa Cruz Biotechnology, Inc.), or anti-p65 (PC137; dilution, 1:100; Calbiochem) antibodies. (Graphs) Fluorescence intensity was determined quantitatively using ImageJ software. Nuclear (N) and cytoplasmic (C) areas were selected manually. The mean intensity of HA-tagged protein in the nucleus minus the mean background intensity is shown along the x axis. The N/C ratio, shown along the y axis, is calculated as (mean intensity of IκBα or p65 in the nucleus − mean background intensity)/(mean intensity of IκBα or p65 in the cytoplasm − mean background intensity). (B) 293T cells were transfected with pCHA, HA-SET-Nup214, HA-DEK-Nup214, HA-Nup214(1057-2090), or HA-SET-Nup214(1637). Two days later, cells were subjected to an immunofluorescence assay using anti-HA (clone 3F10) and anti-IκBα (L35A5; dilution, 1:20; Cell Signaling Technology [CST], Inc.) antibodies. Bars, 20 μm. The fluorescence intensities of nuclear IκBα and HA-tagged protein in each sample were determined quantitatively using ImageJ software and were plotted. A.U., arbitrary units. (C) HeLa cells were transiently transfected with pCHA-SET-Nup214 or DEK-Nup214 and were subjected to IF assays using anti-HA (clone 3F10), anti-cyclin B1 (antibody 4138; dilution, 1:20; CST, Inc.), and TO-PRO-3. Bars, 20 μm. The fluorescence intensity of nuclear cyclin B1 in each cell was determined quantitatively using ImageJ software and was plotted. *, P < 0.005; **, P < 0.0005. (D) HeLa cells were transiently transfected with pCAGGS, SET-Nup214-3Flag, or DEK-Nup214-3Flag and were subjected to IF assays using anti-Flag M2 and to in situ hybridization assays with 10 ng/μl biotinylated oligo(dT)45 or oligo(dA)45 as a probe. Bars, 10 μm. The dot plots show fluorescence intensity, quantified using ImageJ software, as described for panel A.

