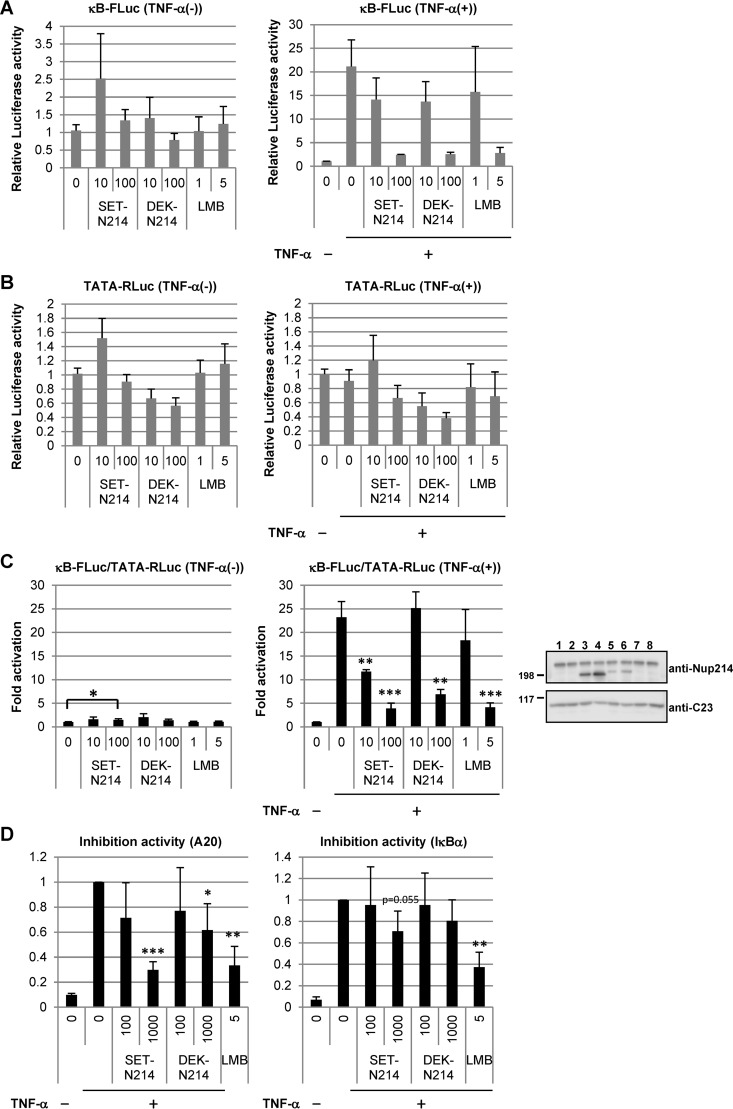
FIG 5.
Effects of SET-Nup214 and DEK-Nup214 on NF-κB transcriptional activity. (A to C) HEK293T cells (3 × 10⁴) cultured in 24-well plates were transfected with pNF-κB40-firefly luciferase (10 ng) and either pCAGGS-SET-Nup214 (SET-N214) or DEK-Nup214 (DEK-N214) (10 or 100 ng). pTA-Renilla luciferase (100 ng) was cotransfected for the normalization of transfection efficiency. At 2 days after transfection, cells were incubated with 1 ng/ml or 5 ng/ml LMB for 30 min. Then recombinant human TNF-α (catalog no. 300-01A; PeproTech) was added at a final concentration of 20 ng/ml; the mixture was incubated for 3 to 4 h; and cell lysates were subjected to luciferase assays using the Dual-Luciferase reporter assay system (Promega) according to the manufacturer's instructions. Luminescence was measured by a Centro XS3 LB 960 luminometer (Berthold Japan K.K.). Relative firefly luciferase activity (A), relative Renilla luciferase activity (B), and normalized luciferase activity (C) were expressed as fold activation relative to the conditions in the leftmost lane (assigned a value of 1). Data are means ± standard deviations for three independent experiments. (C) The P value was calculated relative to the first (left graph) or second (right graph) lane. *, P < 0.05; **, P < 0.005; ***, P < 0.001. Western blot analyses were performed using lysates prepared for luciferase assays in the presence of TNF-α. Anti-Nup214 and anti-C23 (D6; dilution, 1:1,000; Santa Cruz Biotechnology, Inc.) antibodies were used as primary antibodies. Molecular weights (in thousands) of prestained markers are indicated on the left. (D) HEK293T cells (3 × 10⁵) cultured in 6-well plates were transfected with pCAGGS-SET-Nup214 (SET-N214) or DEK-Nup214 (DEK-N214) (100 or 1,000 ng). At 2 days after transfection, cells were incubated with or without 5 ng/ml LMB for 30 min, and TNF-α was added at a final concentration of 20 ng/ml. After TNF-α incubation for 3 to 4 h, cells were collected, and isolated RNAs were subjected to RT-qPCR in order to quantify A20 and IκBα mRNAs. These mRNA expression levels were normalized to the level of β-actin mRNA and are shown as fold inhibition relative to expression in the second lane, taken as 1. Data are means ± standard deviations for three independent experiments. The P value was calculated relative to the value in the second lane. *, P < 0.05; **, P < 0.005; ***, P < 0.001.

