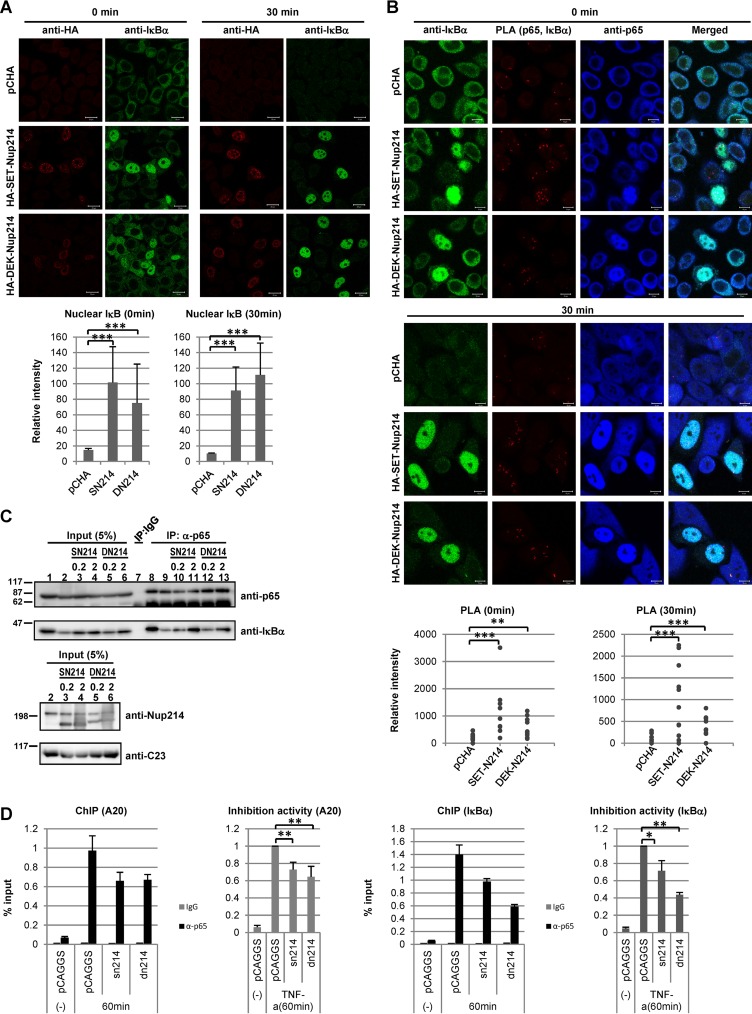
FIG 7.
Interaction of p65 with IκBα or chromatin in the presence of stimuli. (A) HeLa cells were transfected with 1 μg of pCHA, HA-SET-Nup214, or HA-DEK-Nup214. At 2 days after transfection, cells were treated with TNF-α (10 ng/ml) for 30 min, and IF assays were performed using rabbit polyclonal anti-HA and anti-IκBα (L35A5) antibodies. Bars, 20 μm. The fluorescence intensities of nuclear IκBα in control cells, SET-Nup214-expressing cells, and DEK-Nup214-expressing cells were determined quantitatively using ImageJ software. ***, P < 0.001. (B) The protocol was the same as for panel A. After incubation with anti-p65 (ab7970) and anti-IκBα (L35A5), PLAs were performed. “Merged” panels are composite images of cells stained with Alexa Fluor 488, Detection Reagents Red (for PLA), and Alexa Fluor 633. Bars, 10 μm. The sum of the fluorescence intensities of PLA dots in each cell was quantitated using ImageJ software. **, P < 0.005; ***, P < 0.001. (C) HEK293T cells were transfected with 1 μg pCAGGS, pCAGGS-SET-Nup214 (SN214), or pCAGGS-DEK-Nup214 (DN214) (0.2 or 2 μg). At 2 days after transfection, cells were treated with TNF-α (20 ng/ml) for 30 min and were collected, and IP assays were conducted using anti-p65 (ab7970) and rabbit polyclonal IgG antibodies. Proteins in input lysates and immunoprecipitated samples were separated by 12.5% or 5% SDS-PAGE, and Western blot analyses were performed using anti-p65, anti-IκBα, anti-Nup214, and anti-C23 antibodies. Molecular weights (in thousands) of prestained markers are indicated on the left. (D) HEK293T cells were transfected with 2 μg pCAGGS, pCAGGS-SET-Nup214, or pCAGGS-DEK-Nup214. At 2 days after transfection, cells were either left untreated or treated with TNF-α (20 ng/ml) for 60 min and were then subjected to ChIP assays as for Fig. 6C. Left graphs show representative examples of ChIP-qPCR results, and right graphs show fold inhibition relative to the level of DNA immunoprecipitated from pCAGGS-transfected lysates by the anti-p65 antibody in the presence of TNF-α. Data in graphs on the right are means ± standard deviations for three independent experiments. *, P < 0.05; **P < 0.01.

