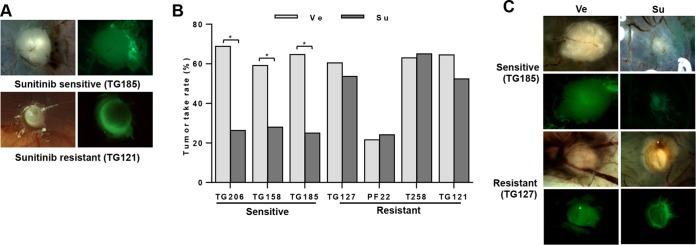
FIG 6.
Testing sunitinib sensitivity using CAM assay. (A) Bright-field and fluorescence images of sunitinib-sensitive and -resistant tumors. Green, tumor cells. (B) Tumor take rates of indicated primary RCC cells treated with vehicle or sunitinib. (C) Bright-field and fluorescence images of sunitinib-sensitive and -resistant tumors following treatment with vehicle (Ve) or sunitinib (Su). *, P < 0.05.

