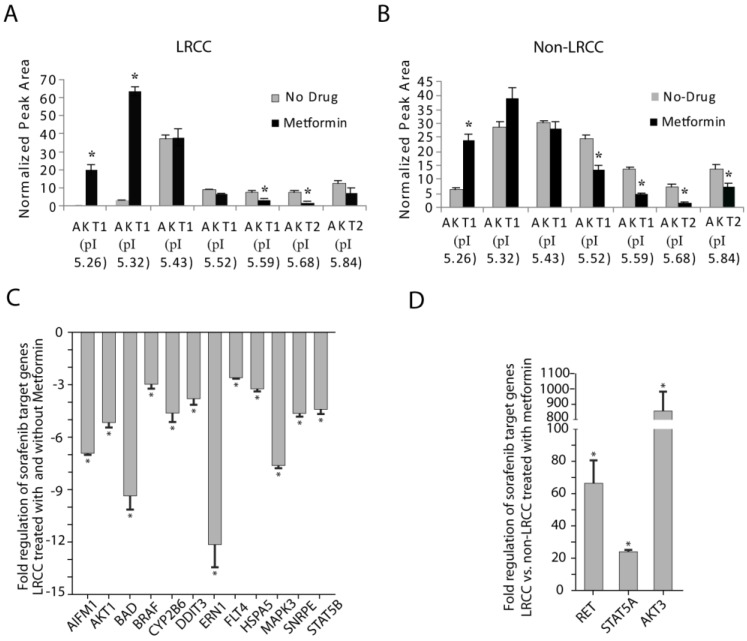
Figure 4.
STP and STG expression in LRCC vs. non-LRCC. (A-B) Compared to non-LRCC, metformin treatment of LRCC resulted in increases of the major highly phosphorylated species of AKT1. (C) STG expression in LRCC before and after treatment with metformin. (D) Compared to non-LRCC, metformin treatment of LRCC resulted in opposite effects by up-regulation of RET, STAT5A and AKT3.

