FIGURE 5.

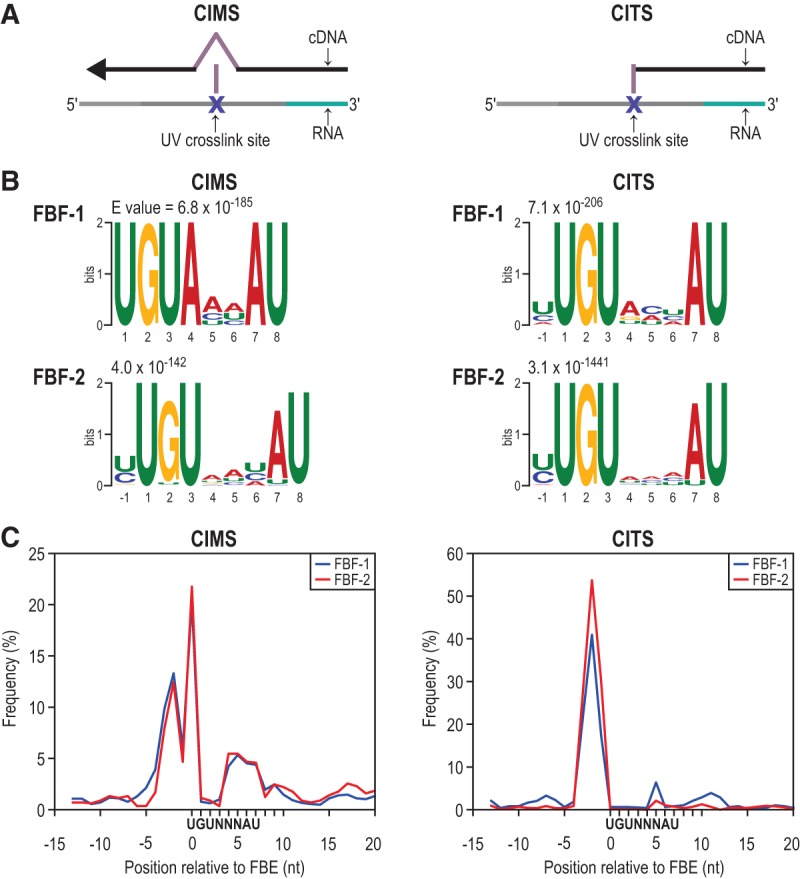
Mapping FBF-1 and FBF-2-RNA crosslink sites. (A) Diagrams of CIMS analysis (left) and CITS analysis (right). Both identify protein:RNA crosslink sites by detecting errors made in reverse transcription during cDNA library preparation. (B) The most significant motifs identified by MEME analysis in a 21-nt window centered around significant (P < 0.001) CIMS and CITS sites are the FBEs (UGUNNNAU, where N is any ribonucleotide). There is a variable nucleotide preference at the −1 and 4, 5, and 6 positions. (C) Crosslink site enrichment relative to the FBE for all FBE-containing clusters demonstrates FBF crosslinks predominantly upstream of the FBE.
