FIGURE 6.
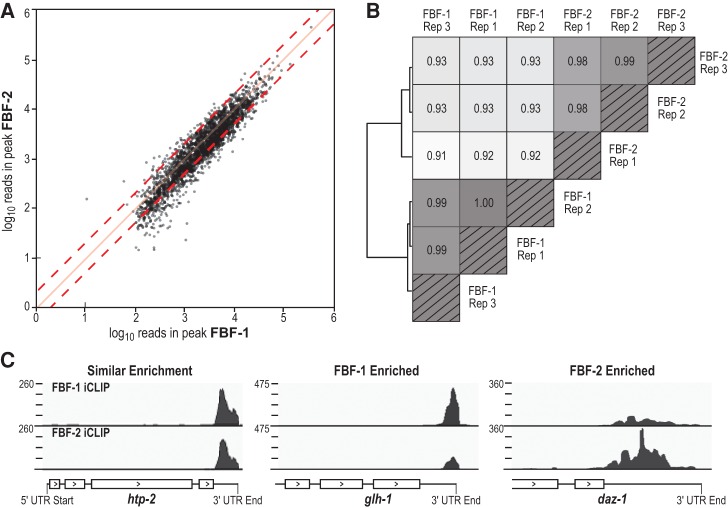
FBF-1 and FBF-2 have highly similar binding landscapes. (A) FBF-1 and FBF-2 peak heights and peak regions are highly correlated. The FBF-2 data set was normalized to the size of the FBF-1 data set. Red dashed lines mark twofold enrichment and solid red line marks a slope of one. (B) Hierarchal clustering of correlations between and within FBF-1 and FBF-2 replicates. (C) Snapshots of enrichment differences for select targets. Coverage is given in reads per million, with the coverage range shown in the upper left.

