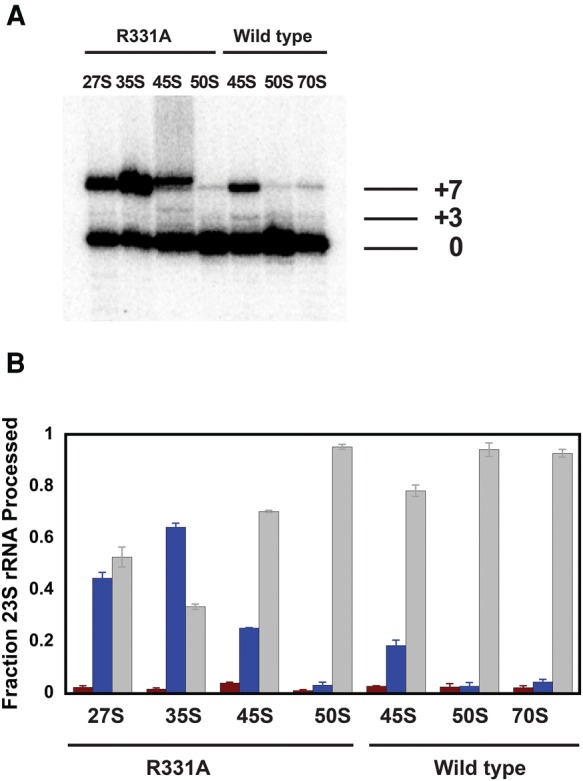
FIGURE 3.

(A) A representative gel showing 5′ maturation of the rRNA for the various particles. The mature, +3, and +7 bands are marked. (B) The fraction of +7 (blue), +3 (red), and maturely (gray) processed 23S rRNA for each particle investigated. The fractions for the +3, +7 and mature population of each particle represent the means from two independent experiments and the errors are standard deviations from those means. The fractions for the +3, +7, and mature population were calculated from the ratio of radioactive counts on a specific band over the sum of counts on the bands representing +3, +7, and mature populations.
