Figure 3.
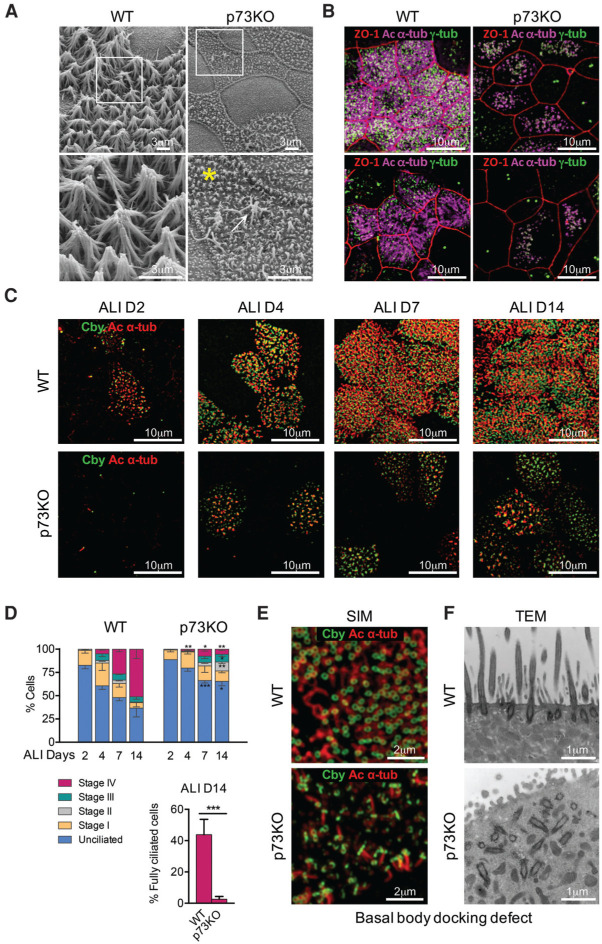
TP73 deficiency in primary organotypic airway cultures recapitulates the profound ciliogenesis defects present in vivo. (A) SEM photomicrographs of MTECs from wild-type (WT) and p73 knockout (p73KO) tracheae at ALI D14. The abundant, long cilia of wild-type MCCs are severely decreased in number and length in p73 knockout MCCs. Only rare normal-length cilia are formed (arrow). Boxed areas are shown as magnifications. Microvilli are preserved (asterisk). (B) Superresolution structured illumination microscopy (SIM). Surface view SIM photomicrographs of wild-type and p73 knockout MTECs at D14, immunostained for ZO-1 marking cell borders (red), axonemal marker Ac α-tub (magenta), and BB marker γ-tub (green). Two different representative MTEC cultures derived from independent animals are shown. (C,D) Quantitation of ciliogenesis stages. MTECs from wild-type and p73 knockout trachea at ALI D2, D4, D7, and D14. The percentages of unciliated cells, cells partially ciliated in stages I–IV of ciliogenesis, and fully ciliated cells were quantified based on immunostained confocal images for axonemal marker Ac α-tub (red) and BB marker Cby (green). Stages are defined as unciliated; stage I, appearance of centrosomal protein foci; stage II, centriole replication; stage III, centriole dispersion/migration; and stage IV, cilium elongation (Tan et al. 2013). (C ) Representative surface view. SIM images. (D) Quantitation of stages. “Fully,” as defined in this assay, is at least 20 cilia per cell. Notably, even fully differentiated knockout cells had far fewer cilia per cell than wild type (which typically have >100 cilia), and any cilia still formed were much shorter. Over 250 cells per genotype per ALI day were counted from three independent MTEC preparations (>750 total cells for each condition). Error bars represent standard error of the mean. P-values show a comparison of wild type versus knockout for each differentiation stage. (∗) P<0.05; (∗∗) P<0.02; (∗∗∗) P<0.001. (E,F ) TP73 deficiency causes docking defects at the apical membrane of MCCs. (E) p73 knockout MCCs show perturbed polarity of the ring-shaped Cby-positive distal appendage structures that facilitate BB docking to the apical membrane via ciliary vesicle formation (Burke et al. 2014). Wild-type and p73 knockout MTECs at D14 and SIM images immunostained for Cby (green) and Ac α-tub (red). (F ) Many BBs fail to properly dock along the apical surface and hence do not give rise to axonemal outgrowth. TEM images of wild-type and p73 knockout MTECs at D14. For TAp73 knockout bronchus, see also Figure 2E and Supplemental Fig. S2E. A, B, C, E, and F are representative images of at least five independent biological replicas of MTEC cultures.

