
Figure 1.
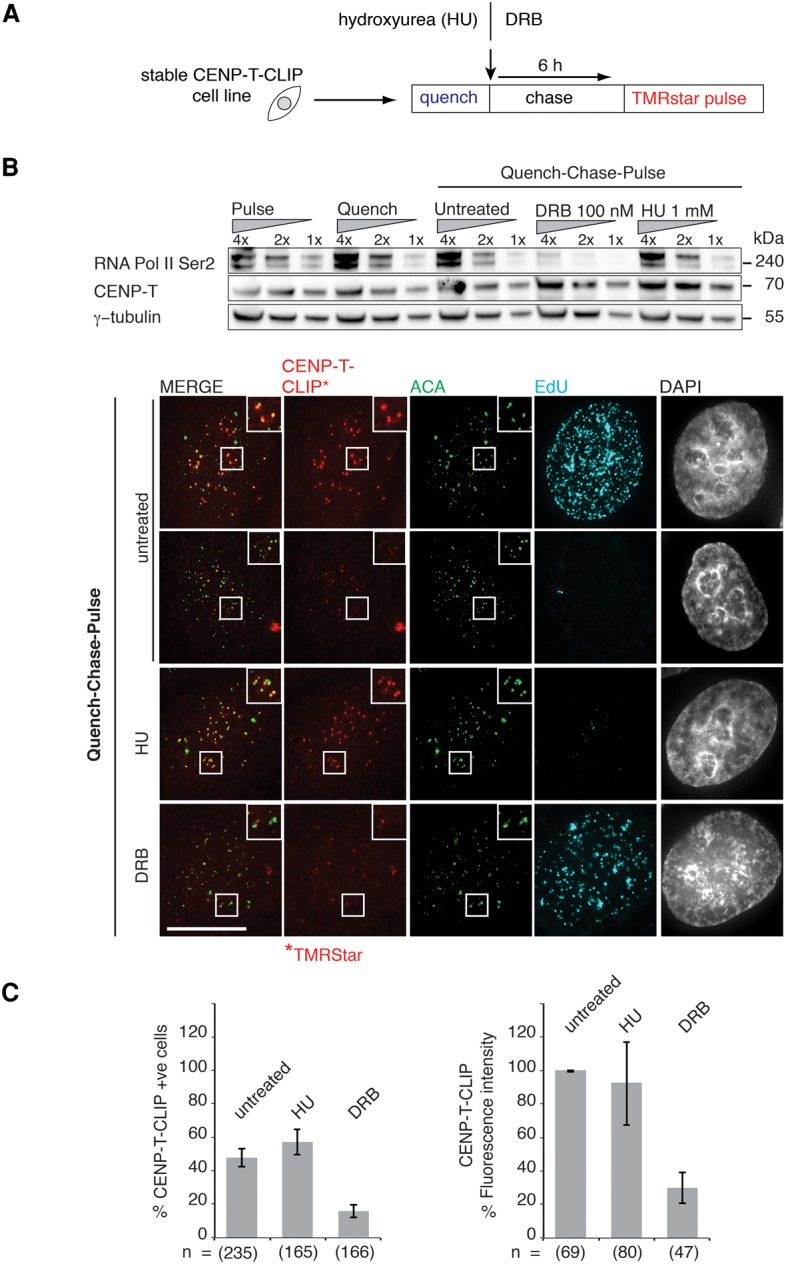
Assembly of newly synthesized CENP-T is uncoupled from DNA synthesis. (A) The experimental scheme outlines the quench–chase–pulse approach. A conditional in vivo labeling strategy was used, as previously described (Prendergast et al. 2011). (B) Cells expressing CLIP-tagged CENP-T in an asynchronous culture were labeled with CLIP cell block (New England Biolabs) to “quench” reactive CLIP proteins. A “chase” time was used to allow synthesis of “new” protein. The newly synthesized protein labeled with a “pulse” of fluorescent CLIP substrate. Final drug concentrations of 100 nM β-D-ribofuranosylbenzimidazole (DRB) and 1 mM hydroxyurea (HU) were added during the quench and maintained throughout the experiment. Western blot shows reduced levels of RNA polymerase II (Pol II) Ser2 in DRB-treated samples. BTC (immunofluorescence) with anti-centromere antibody (ACA) (green) was used to select centromeres. EdU (cyan) shows cells undergoing active DNA synthesis, while TMR-Star (red) was used to label new CENP-T-CLIP proteins. Bar, 10 µM. “Untreated” EdU-positive cells display assembly of newly synthesized CENP-T-CLIP at centromeres. EdU-negative cells do not show assembly. (C) The numbers of cells with detectable assembly (five CENP-T-CLIP-positive centromeres or more visible) were counted, and fluorescence intensities of centromeres were also measured. Approximately 43% of cells in a total untreated population exhibit newly synthesized CENP-T-CLIP signal at centromeres following a quench–chase–pulse assembly assay. In HU-treated samples, 56% of the population have newly synthesized CENP-T-CLIP signal at centromeres. In DRB-treated cells, 14% of the population have newly synthesized CENP-T-CLIP signal at centromeres. The fluorescence intensities of centromeres in EdU-positive cells are also reduced in the DRB-treated samples. Experiments were repeated three times, with a minimum of 30 S-phase cells counted for each experiment. n = number of cells. Error bars represent standard error of the mean (SEM).