Figure 2.
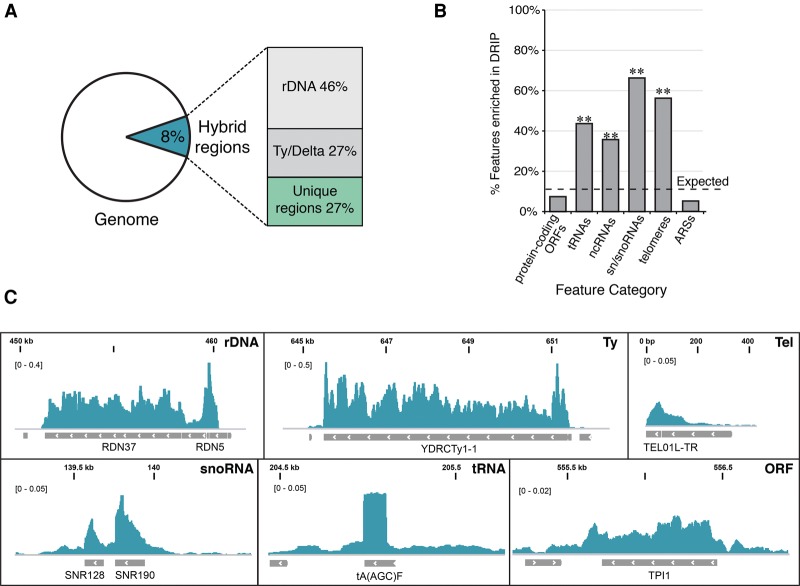
Genomic distribution of hybrid-prone regions. (A) The percentage of base pairs in the genome prone to hybrid formation in rnh1Δrnh201Δ and the breakdown relative to repetitive (rDNA and Ty/Delta) and nonrepetitive (unique) regions. (B) Hybrid-prone features. The proportion of major genome features identified as hybrid-prone. The dotted line indicates the proportion of all features identified as hybrid-prone (9.6%). P-values were generated by a one-tailed Fisher's test. (**) P < 0.001. (C) Snapshots of representative hybrid-enriched features from rnh1Δ rnh201Δ. From left to right and top to bottom: rDNA (RDN37-1, chromosome XII, 450,000–460,000), Ty element (YDRCTy1-1, chromosome IV, 645,000–652,000), telomere (TEL01L-TR, chromosome I, 0–400), small nucleolar RNA (snoRNA) (SNR128 and SNR190, chromosome X, 139,000–140,500), tRNA [tA(AGC)F, chromosome VI, 204,500–205,5000], and protein-coding ORF (TPI1, chromosome IV, 555,000–557,000).

