
Figure 5.
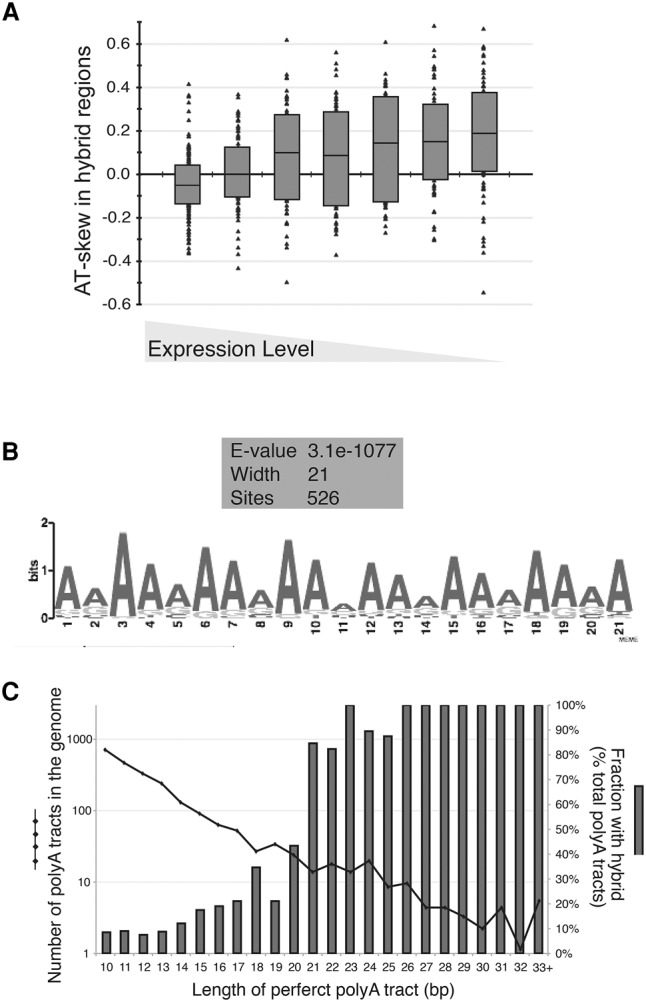
Positive AT skew and polyA tracts contribute to hybrid formation. (A) AT skew of ORF-associated hybrid regions. AT skew was calculated as (A − T)/(A + T) in each hybrid-prone region and was binned in the expression category of its associated ORF (expression categories were divided as 1, 2, 3–4, 5–8, 9–12, 13–16, and 17–20). Individual values are plotted along with the box plot showing the first quartile, median, and third quartile value for each expression category. (B) A common motif in hybrid-prone regions. The 779 identified hybrid-prone regions were analyzed by MEME for the presence of overrepresented motifs. MEME identified a 21-bp adenine-rich motif present in 526 of the 779 regions. (C) The occurrence of perfect polyA tracts and hybrids genome-wide. The length of the polyA tract is indicated on the X-axis. The number of polyAs of a given length present in the genome is represented by the black dotted line (left Y-axis), and the fraction overlapping a hybrid region is represented by the dark-gray bars (right Y-axis).