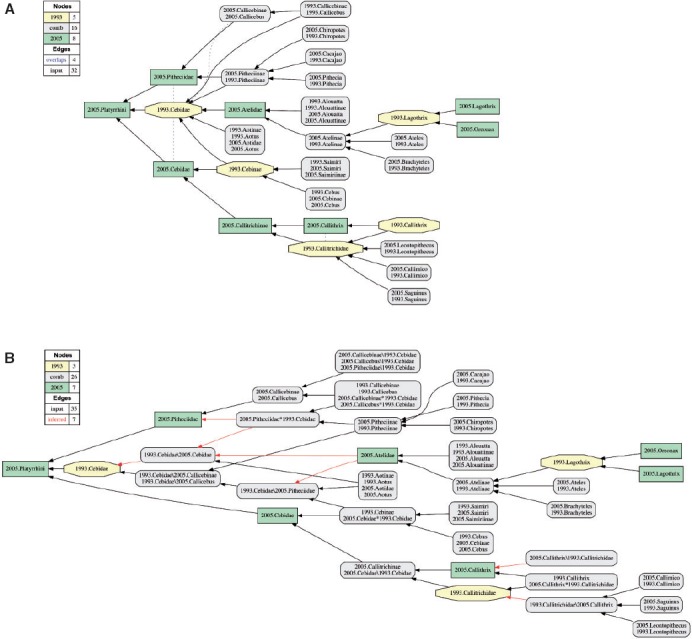
FIGURE 6.

Visualization of the parvorder- to genus-level alignment corresponding to the 2005.Platyrrhini and 1993.Callitrichidae/1993.Cebidae (see also Supplementary Fig. S3–2 available on Dryad). A) Reduced containment graph visualization, with overlap shown. B) Combined concept visualization (see Franz et al. 2015), using the C1\C2, C2\C1, (where “\” = not), C1∗C2 (where “*” and) annotation to identify Euler subregions that result from input concept overlap. Recognizing such newly inferred Euler subregions in the=alignment increases the number of inferred articulations (red arrows).
