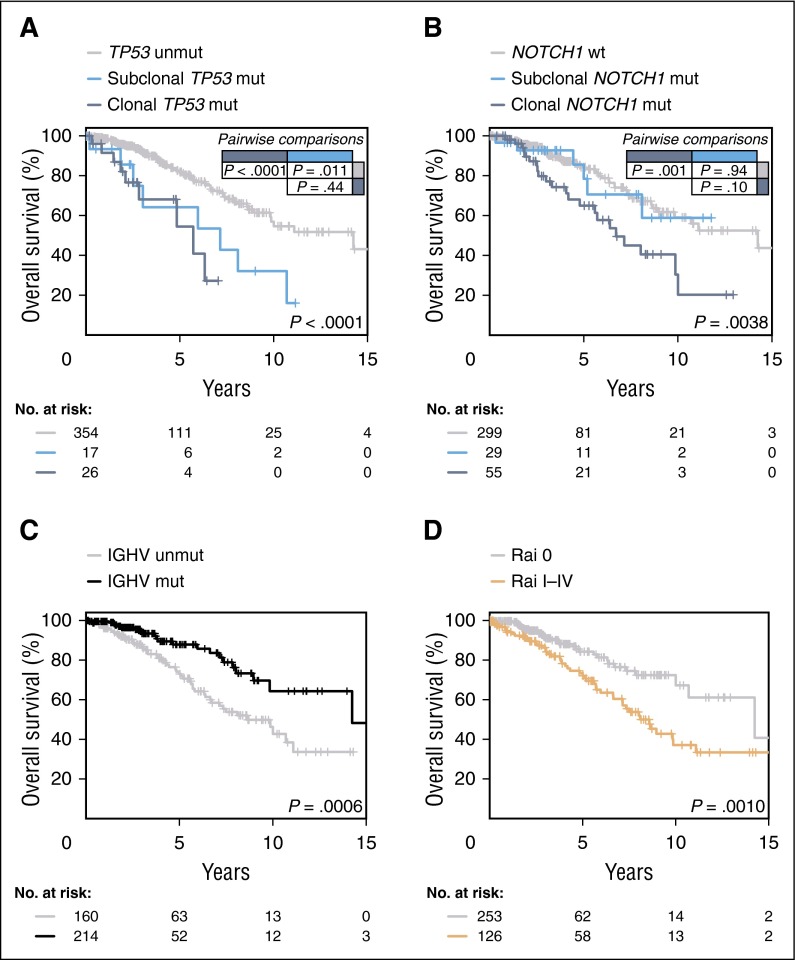
Figure 4.
OS according to gene aberrations. (A) Comparison of OS among patients carrying subclonal TP53 mutations (light blue line), clonal TP53 mutations (dark blue line), and cases harboring an unmutated TP53 gene (gray line) (P < .0001 for clonal mutations vs WT; P = .011 for subclonal mutations vs WT; P = .44 for clonal vs subclonal mutations). (B) Comparison of OS from date of sampling between CLL patients carrying subclonal NOTCH1 mutations, clonal NOTCH1 mutations, and WT NOTCH1 gene (light blue, dark blue, and gray lines, respectively) (P = .001 for clonal mutations vs WT; P = .94 for subclonal mutations vs WT; P = .10 for clonal vs subclonal mutations). (C) Comparison of OS among patients carrying mutated (black line), and unmutated IGHV genes (gray line) (P = .0006). (D) Comparison of OS among patients diagnosed with Rai I-IV (orange line), or Rai 0 disease (gray line) (P = .001). P, P values by log-rank test.

