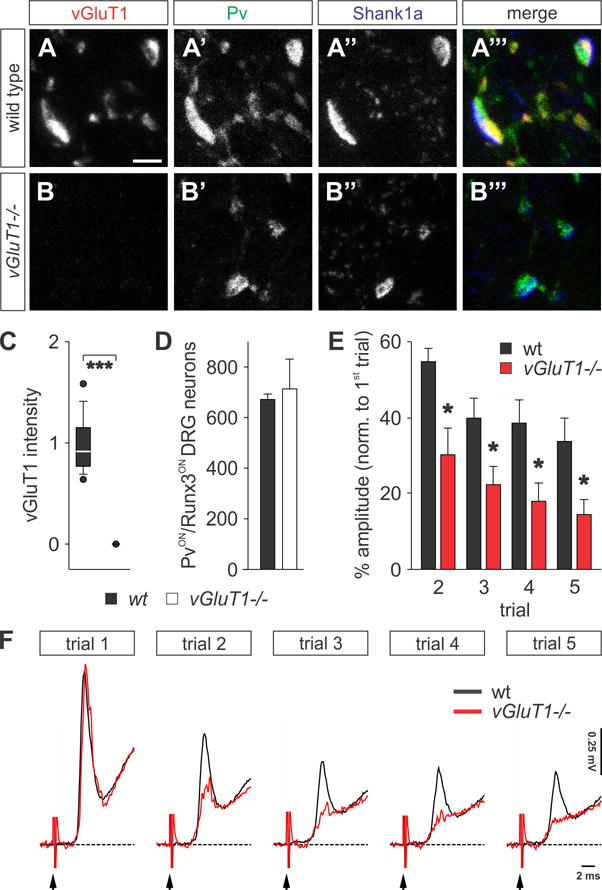
Figure 1. Physiological deficits at sensory afferent terminals in vGluT1−/− mice.

(A–B‴) PvON (green) proprioceptive afferent terminals are juxtaposed to postsynaptic Shank1a (blue) in p12 wt (A–A‴) and vGluT1−/− (B–B‴) mice (similar results obtained at p21 (Figures S1K and S1L). (B) Complete absence of vGluT1 immunoreactivity (red) in sensory terminals of vGluT1−/− mice.
(C) Quantification of vGluT1 fluorescence intensity in proprioceptive afferent terminals of p12 wt (n = 133 boutons, 3 mice) and vGluT1−/− spinal cords (n = 101 boutons, 3 mice). vGluT1 levels are not detectable in vGluT1−/− mice (Mann-Whitney Rank Sum, p < 0.001 ***).
(D) Number of PvON and Runx3ON proprioceptive sensory neurons in L4 dorsal root ganglion (DRG) in wt and vGluT1−/− mice (n(wt) = 1343 neurons; n(vGluT1−/−) = 1427 neurons; Mann-Whitney Rank Sum, p = 1.00 NS).
(E) Quantification of the monosynaptic reflex amplitude at different trials as a percentage of the first trial. The reflex is significantly more depressed in vGluT1−/− mice (n(wt) = 5; n(vGluT1−/−) = 4; t-test, p = 0.013 * (2nd trial), 0.043 * (3rd trial), 0.048 * (4th trial), 0.048 * (5th trial)).
(F) Fifth lumbar segment (L5) ventral root responses following repetitive stimulation (5 trials at 1 Hz) of the homonymous dorsal root at supramaximal intensities (5x threshold) in p12 wt (black) and vGluT1−/− (red) mice. Black arrows indicate the stimulus artifact.
Scale bar: 2.5 μm (A–B‴). Error bars represent s.e.m. Lines and whiskers on box diagrams represent data between 9th and 91st percentile, dots show the 5th and 95th percentile. See also Figure S1.
